Hi!
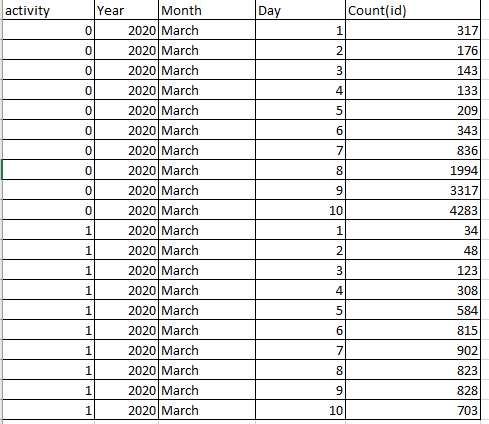
I need to construct a line plot with two different lines for the same column but with different condition. So for example I have this tables:
If activity=0, i want to represent the trend on count(id) over the period, if activity=1 the other line.
How can I do that? if I choose the line plot node I cannot obtain two lines
Hi Giada,
you can do that using the Pivoting node. Select Year, Month, and Day as Group columns and activity as Pivot column. In the aggregation tab, select Count(id) with aggregation method “First”. Now you will obtain two columns: one for activity=0 and one for activity=1. Those you can then display in your line plot.
Kind regards
Alexander
Perfect, and how can I put on the x axis day and hour for example? Now I choose only one column for the x axis, but I need to put 2 or more, for example, for each day I need to see also hour…
Hi,
For that you need to convert your string date to a real date using the String to Date&Time node. Then you can extract the parts you want with Extract Date&Time Fields and use String Manipulation to join some of the components you extracted together so you can use it on the x-axis. You can also use the date column directly as x-axis.
Kind regards
Alexander