Hello all,
Is there a way to get the x-axis values from the peaks of a curve?
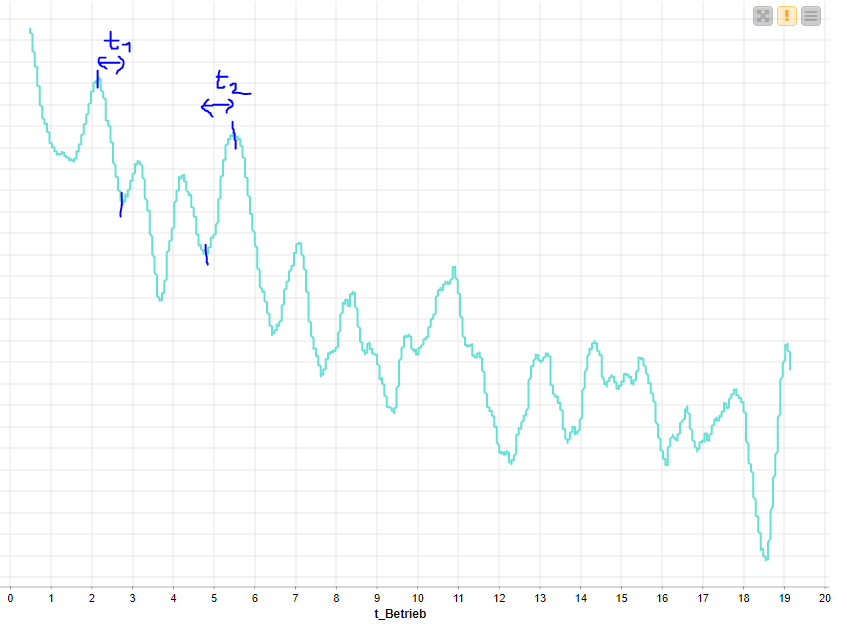
My goal is to get the time difference between two peaks like it is shown in the picure below:
Thank You in advance!
Hello all,
Is there a way to get the x-axis values from the peaks of a curve?
My goal is to get the time difference between two peaks like it is shown in the picure below:
Thank You in advance!
Hi @Jorisr10,
are you interested in the difference on the x axis between each minima and maxima, or just between some?
The linked workflow extracts the extrema (all maxima and minima) for you. In the composite view you can then select two extrema, for example one maxima and one minima, and the workflow calculates the difference on the x-axis.
Based on the table with the extrema you can calculate the difference between each minima and maxima as well.
Please have a look at the workflow and let me know in case of any questions.
Kathrin
Hi Kathrin,
This looks like what i searched for!
My Problem is, my timeseries does not looks as nice as the one you used. I will attach it below:
Data.xlsx (16.0 KB)
My goal is to count the bigger maxima and minima which can be seen in the curve and ignore the little ones.
Do you have any ideas how i have to change your initial workflow to achieve that?
Thank you very much!
Joris
Hi @Jorisr10,
my opinion ist first use a moving average for smoothing the curve. After smoothing you could identify the individual peaks by comparing the actual value with the previous value. If the value decreases your previous value was a maximum value.
Hopefully this helps you.
BR
i have now managed to do it with the example of kathrin.
The problem is that I have 300 curves and would like to use this evaluation procedure in a loop.
Is it possible to access the following two columns with the Math Formula Node by variables?
Because I have to calculate as shown in the example of kathrin:
value - lag.value1 and lag.value1 - lag.value2.
is it possible to do this in a loop?
BR Joris
Hi,
do your column names change in the different iterations?
If yes, I would use twice the column rename node. One in the beginning of the loop to rename the columns of interest into some standard names (here you can use flow variables) and one in the end of the loop to use the original names again.
This workflow shows you an example: https://kni.me/w/UM7KvEz4td-Geyxd
Best
Kathrin
Hi @Kathrin,
Thats works perfect, thanks!
I checked the maximum determination again and noticed that if a value remains constant for 2 or more time units, it is not recognized as an extreme value.
Here is an example:
Any idea how I could fix this?
Hi @Jorisr10,
you can update the Rule Engine node using the following expressions.
$Diff1$<0 AND $Diff2$>=0 => “Maxima”
$Diff1$>=0 AND $Diff2$<0 => “Minima”
Best
Kathrin
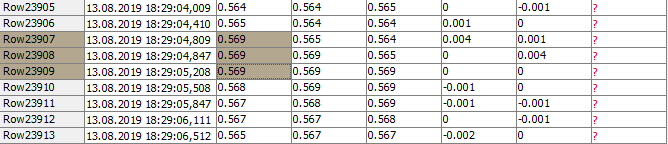
Hello @Kathrin
In the Solution right now, the extreme value is printed, due to the calculation withe the lag columns, always one row after the real extreme value (Picture below):

Is there any way I can fix this?
Thank you!
BR Joris
Hi @Jorisr10,
I updated the workflow on the Hub to fix the issue:
The idea is to rename the columns using the column rename node to have the time series data for t-1, t, and t+1 in one row.
Best
Kathrin
This topic was automatically closed 182 days after the last reply. New replies are no longer allowed.