Hi
I created this 2 models. Now I need to find a way to plot a ROC chart that combines this 2 models. How do i do it? Cant seem to find a way.
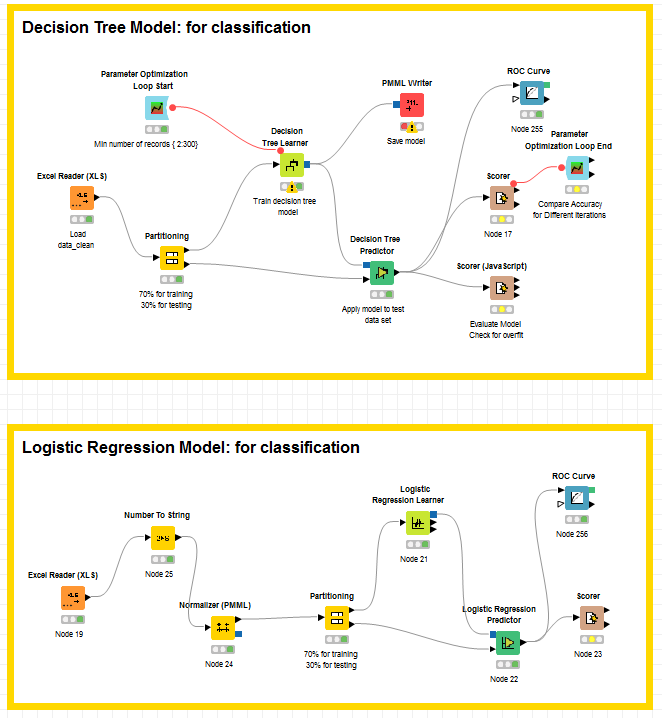
Hi,
to compare the two models I would use the same partitioning for both models.
You can then combine the probability predictions for both models with the column appender node and create one ROC curve for both models.
Regarding the normalisation in your workflow (which would use for logistic regression as well). I would use the Normalizer node only on the training set and apply the same transformation to the test set with the Normalizer (Apply) node.
Best
Kathrin
3 Likes
This topic was automatically closed 182 days after the last reply. New replies are no longer allowed.