Question 1: How did you do this? Because when I want to follow the tutorial, spend Reporting ports via the component dialog, the component won’t run at all
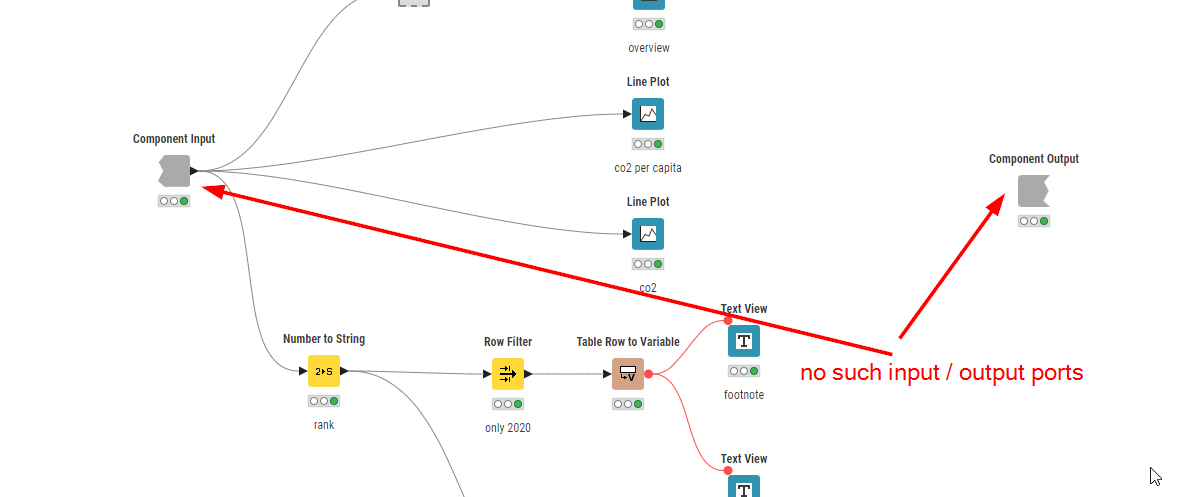
Question 2: Isn’t that counter-intuitive to the whole KNIME experience? If I add a node to a component, no matter what type, it should be reflected inside the component (or am I mistaken here??)
You have to tell it the output is for reporting now. I haven’t delved too far into the new reporting capabilities, since I still have so many reporting challenges that aren’t supported in the native chart nodes or easy to incorporate using D3 or Python charts.
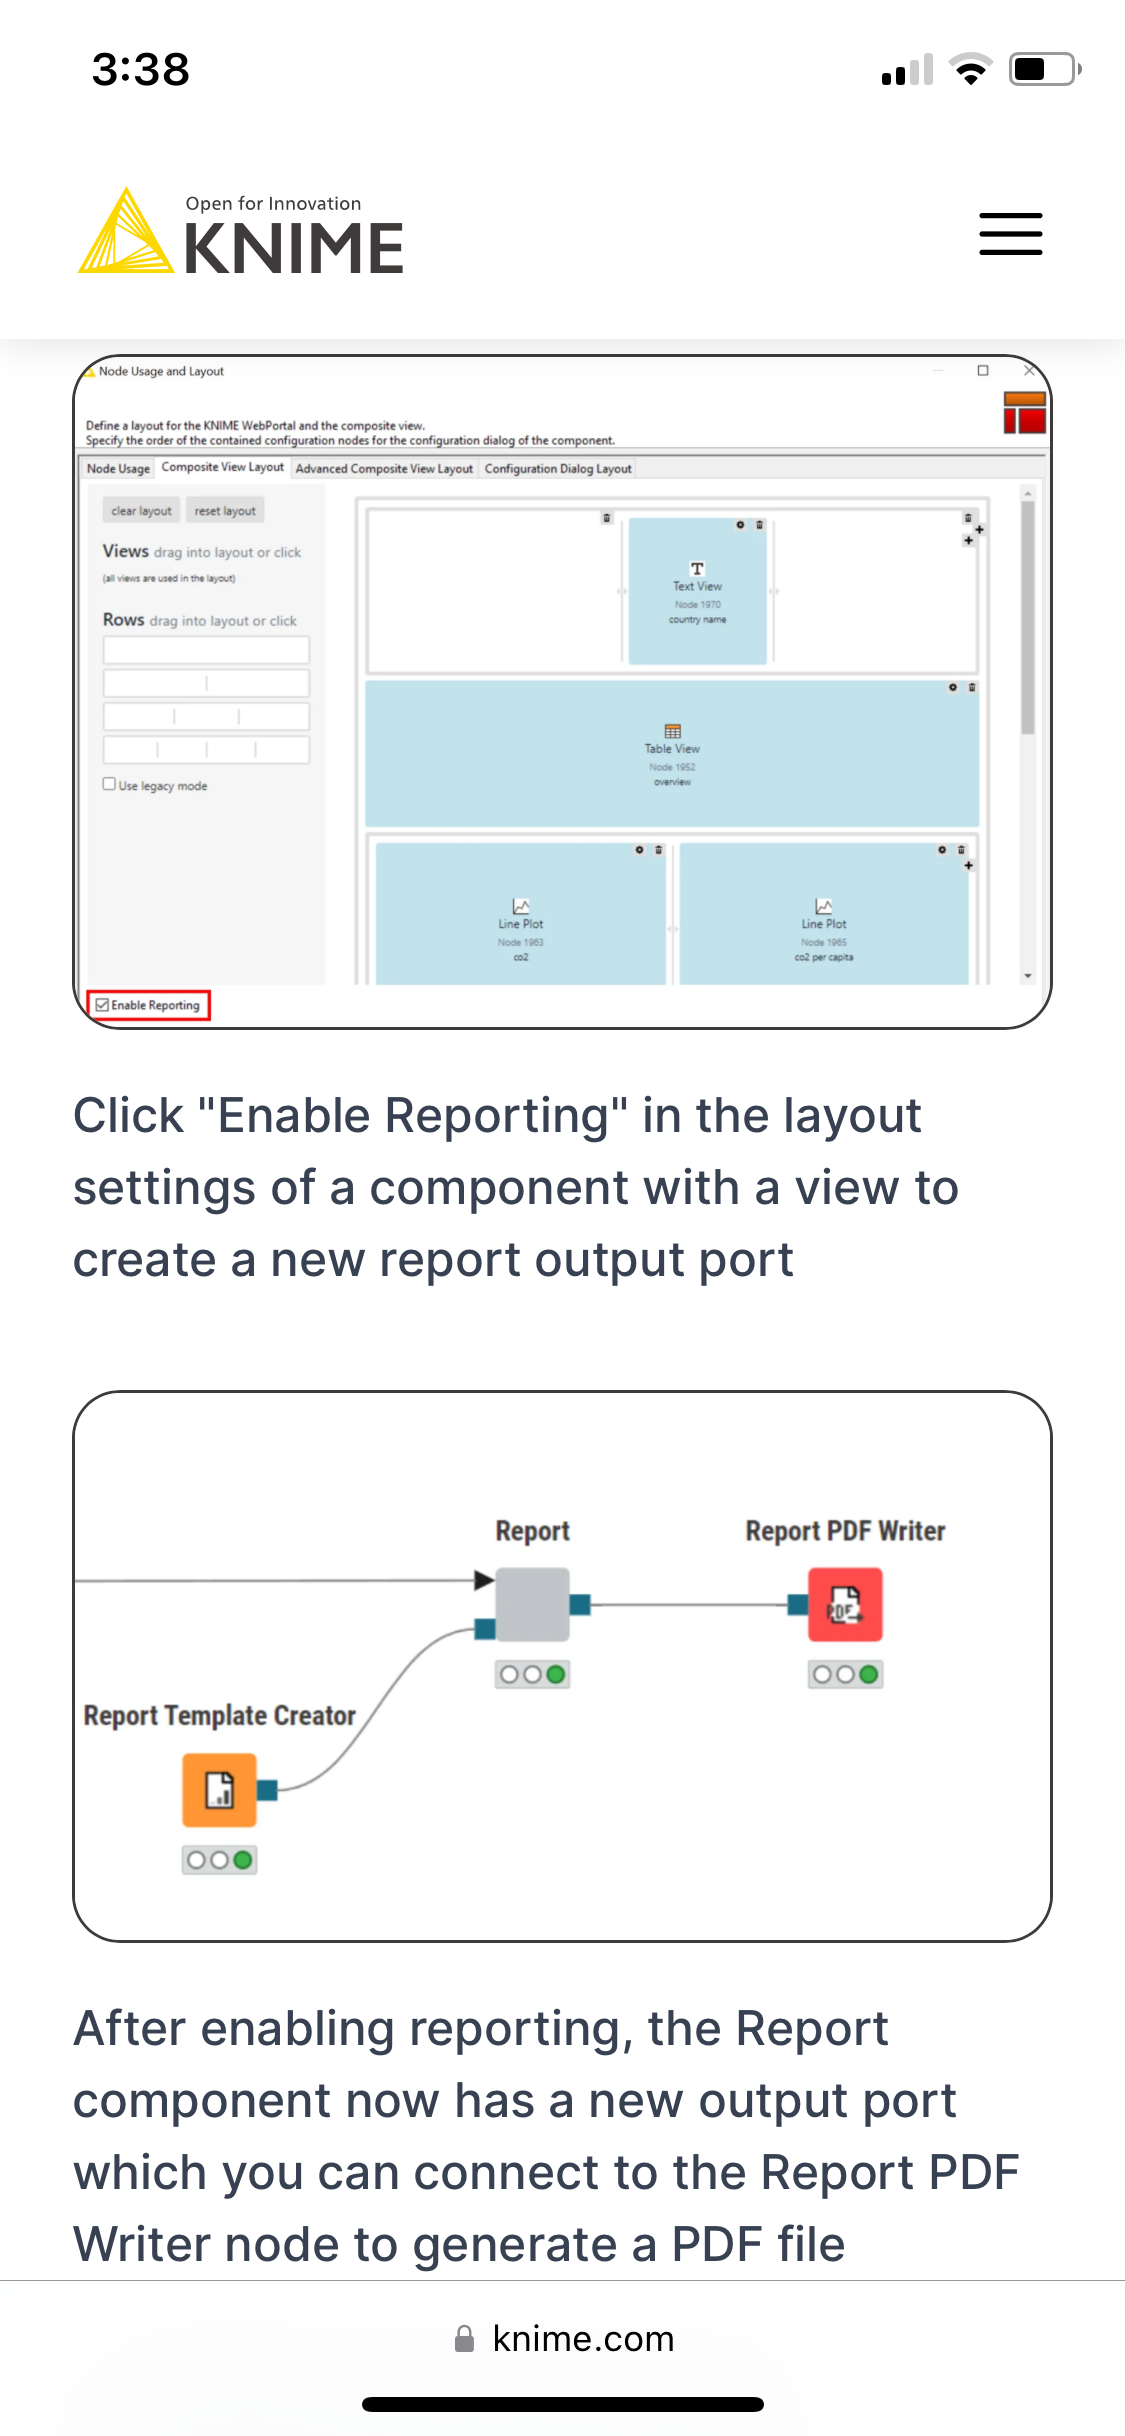
In the meantime I figured out that you need to click “Enable Reporting” within the layout editor to get those nodes. So the ‘standard way’ of adding nodes is not what one needs to do here (learning for me and eventually also for others reading this).
Just one question: when you create report on ‘external libraries’ you can’t utilize those in the new reporting nodes, can you?