Summary : From a Orders TableA dataset retrieve a ProjectType, then Filter another dataset TableB with multiple ProjectType Boolean Columns, based on retrieved ProjectType in Table A.
From a Orders Table dataset,
Filter data in another TableB based on a Selection of ProjectType in OrdersTableA
Columns G - M in this other TableB, represents different ProjectTypes
that are Boolean.
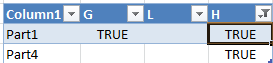
So if a Selection was made in Orders TableA for ProjectType M,
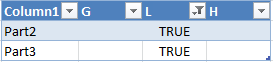
the other TableB will filter to all the rows that are True for that column.
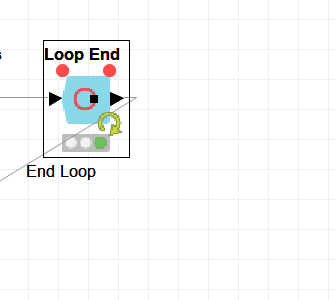
The NEXT order in the loop is for ProjectType G, and all rows are filtered for True in the Other TableB.
The other TableB is unfiltered for each order in the loop.
Hi @DavisRogers,
I can’t really see a question in your post. What are you trying to achieve exactly? It is also always helpful to share workflows and screenshots of what you already got and what you tried.
Kind regards
Alexander
Hi,
could you also attach a workflow? It’s much easier to give you a solution with some data. It does not need to be the original data. An example with some rows for both tables would be enough.
Kind regards
Alexander
Thanks for the example. You are using a very interesting dataset to start this workflow. I am not certain if I follow this approach. I do see what is happening to a certain degree, but I find myself trying to understand the flow instead of using the flow. Shouldn’t I be able to use this flow with the example I provided, to see it work the way I have illustrated above? The end result would be a tableset that is filtered to be True. Thanks for any help…
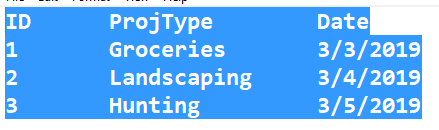
OK the Orders Table, is a table that has numerous Orders that have to have a loop for each Order.
Within that Order is a ProjectType that has to be analyzed. Here is the illustration…
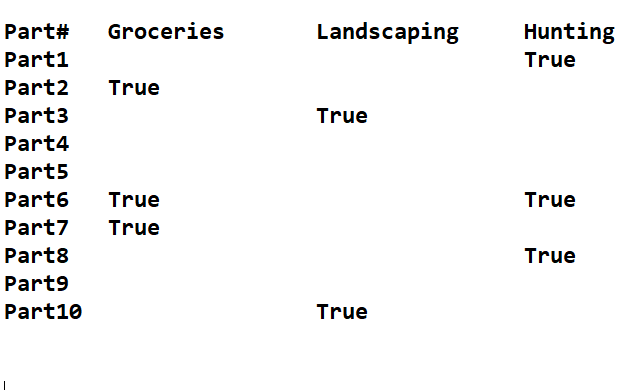
So in the 1st Order there is a ProjectType for “Groceries” and the Project TableB has to be filtered to True for that ProjectType. The challenge is there are numerous ProjectTypes. So how to filter on the ProjectType for Groceries is the challenge. Here is the Table to be filtered in your example…
So in the 1st Loop, we have “Groceries”, the filtered table should look like this…
So in the 2nd Loop, we have “Landscaping”, the filtered table should look like this…
So in the 3rd Loop, we have “Hunting”, the filtered table should look like this…
But what if there was a True in the table such that Groceries was True for Part 1 and we were filtering for Hunting, the results would look like this…
Do you think using the unpivot node is the proper approach with this clarification? I sure think its a great potential. I would like to see the loop of TableA in the solution with orders, to understand how this would be done.
With this explanation your approach looks artificial. Automation assumes centralized data collection. What your try to do just use scattered Excel reports. For this type of task Excel table joins and Pivot tables perfectly works.
Hi,
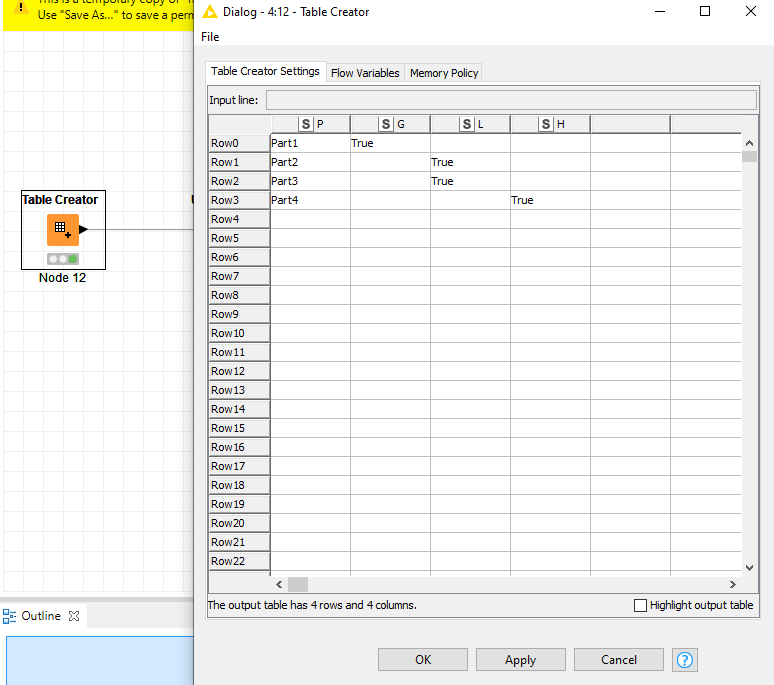
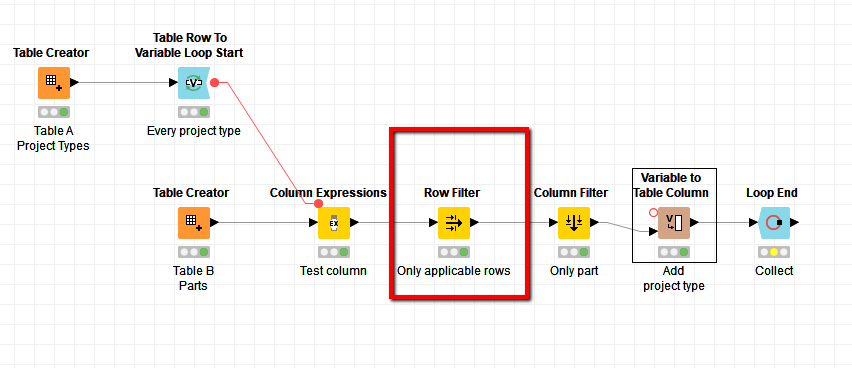
does the attached workflow solve your problem? It assumes that the column names in table B match your project types. If this is not the case, you have to adjust the column expression accordingly to calculate a column name from a project type.
Kind regards
Alexander projectTypes.knwf (18.1 KB)
Thanks for this example. I do feel that this is the proper approach and allows me to continue with a workflow challenge. I hope to be able to help others like this when I learn more about how this works.
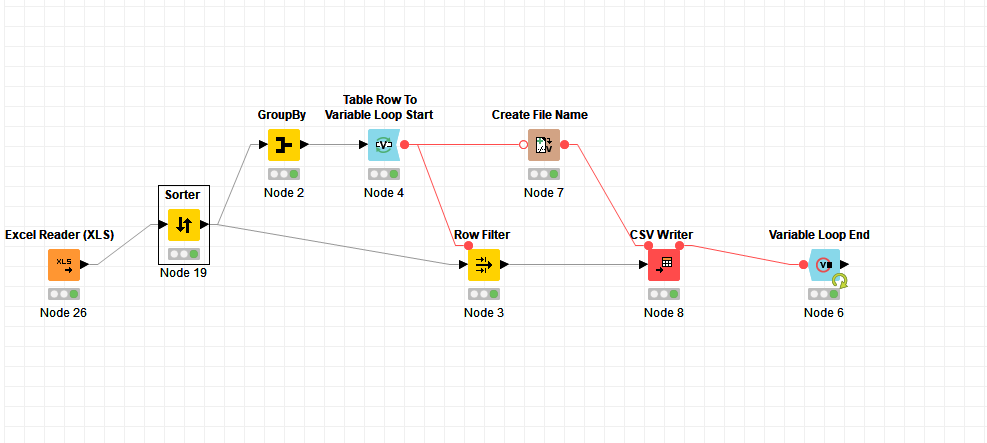
If I wanted to have the report kick out into a google sheet or CSV file, for each iteration of the loop, how would I do that and have the file named after a ProjectType or some other column like an email column?
I would like to have a report kick out at each iteration of the loop at this point of the workflow into a spreadsheet. The other nodes in the workflow appear to be metadata of results that I don’t think would be necessary but it is interesting to see how this works.
I did a CSV Writer and then a CSV Reader to create a link. Not sure if there is a node for doing it within KNIME, please let me know if this is on the correct track.
Is there a way to have live hands on workflow building collaboration. I think that would be a lot faster. I know the workflow, I just don’t know all of the necessary nodes like I need to. Please advise.