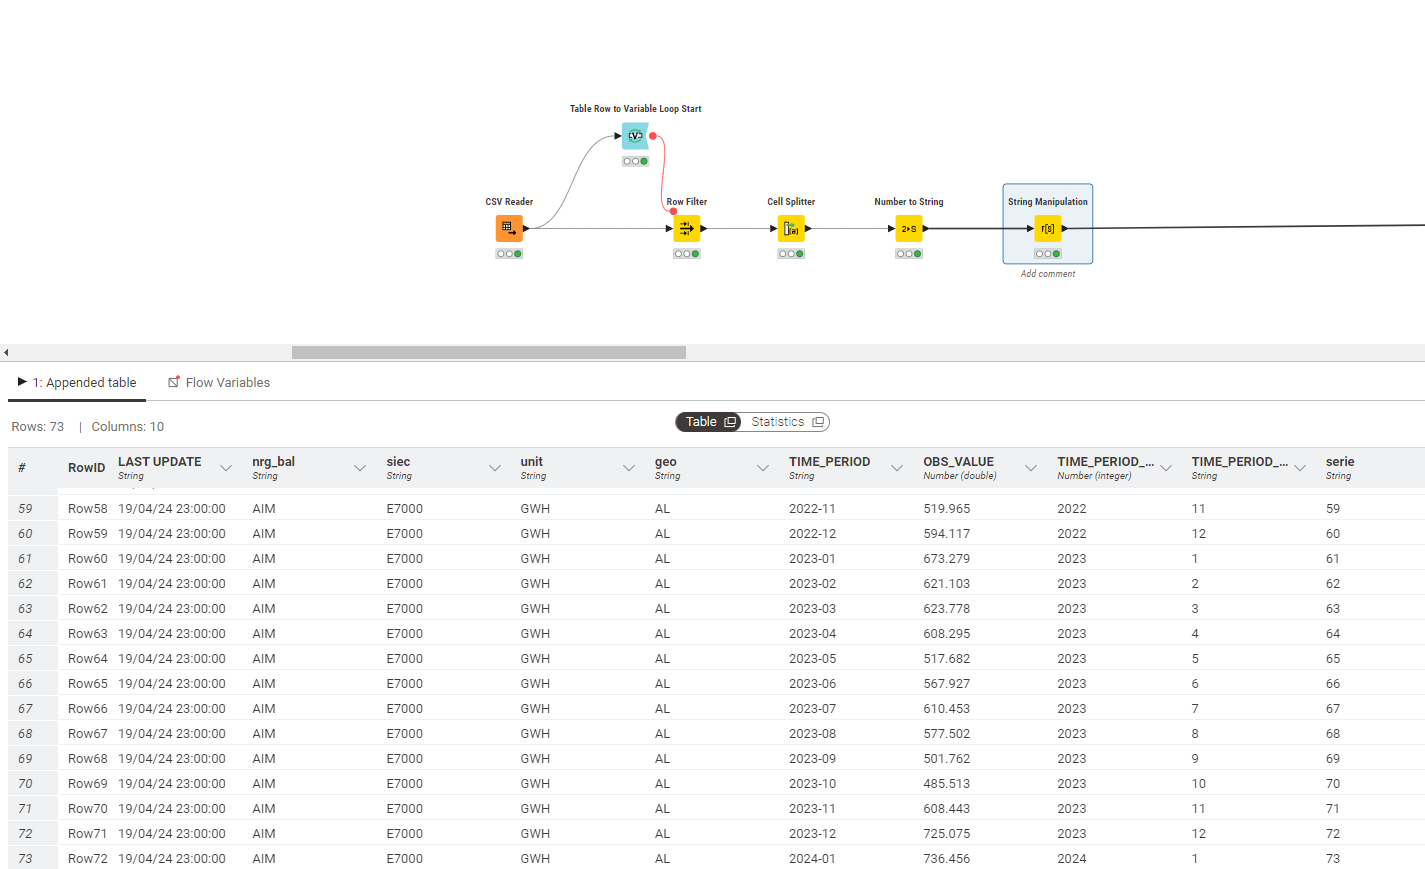
I’m seeking assistance with automating my forecasting process. I’m endeavoring to predict future trends for various countries using a linear regression learner. Each country’s dataset comprises information spanning different time periods. With historical data from these periods, I aim to train the model to forecast the upcoming 6 months. The data includes separate values for each month and year, alongside a sequential series indicator.
To expedite this process, I’ve integrated a loop variable node for geographic regions (GEO). This loop iterates through each country, retrieving all information. The goal is to construct a comprehensive table for the regression predictor node. This table ensures that the model considers the latest available data, accurately accounting for the corresponding year, month, and continuation of the series.
I’m seeking guidance on optimizing this automated model setup to ensure efficiency and accuracy in forecasting.
This is my data:
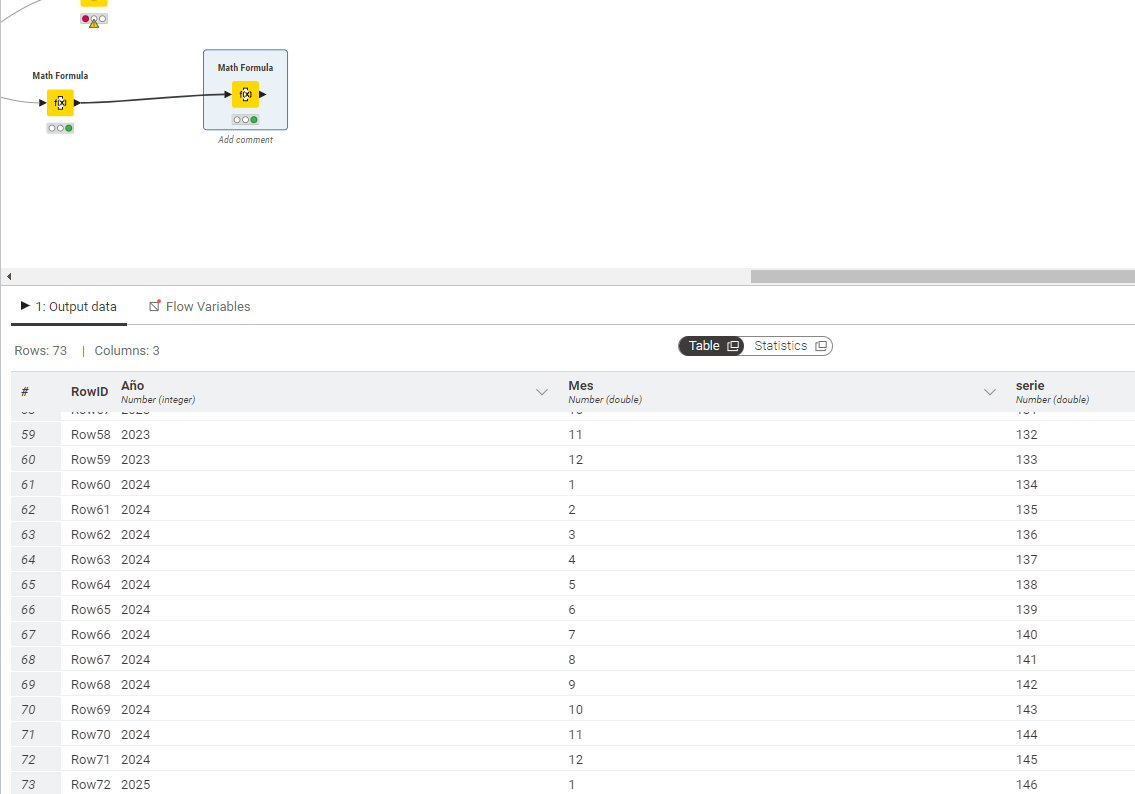
This is this is what i need.
PD: The example isn’t quite right because I’m not sure how to add the condition by month yet