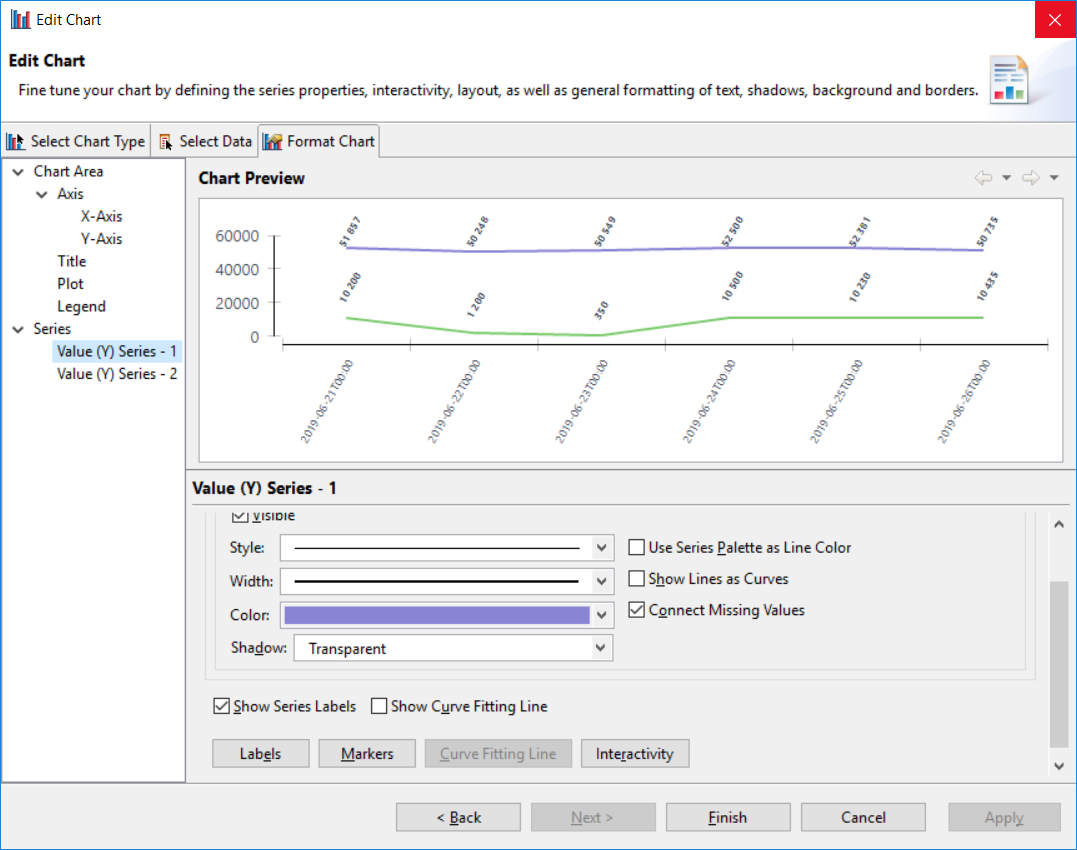
Hi! Are there any ways to place values to a line plot? I mean, I want to do like this:
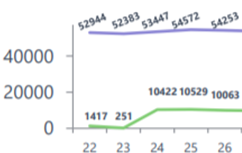
JS line plot allows to draw only lines without values.
Thanks.
Hi! Are there any ways to place values to a line plot? I mean, I want to do like this:
JS line plot allows to draw only lines without values.
Thanks.
Hi there @Evgeniy,
Welcome to KNIME Community Forum!
If I may ask are you doing this for reporting and your plot should have values when exported/in a report or for analysis? If for analysis you can use Line Plot from Plotly Integration which is available in new KNIME version (4.0.0.) cause hoovering over points in Interactive view will show you corresponding values.
Additionally this feature should be added soon to Line Plot (Plotly) node.
Br,
Ivan
@ipazin , thanks a lot. I do it for a report, not for analysis. I tried Plotly line plot but actually it is really shows it after hovering only.
I think I’ve found the way: I’ve made a report in BIRT using my data and there was an option to show value labels.
This topic was automatically closed 182 days after the last reply. New replies are no longer allowed.