Dear Knimers, I bring you here a (possibly) very simple question:
How to create 12 new monthly columns in a table with only one column per year? I need to input monthly intermediate values…
Thank you for any help or suggestion.
Rogério.
Hey there,
maybe you can share a simple example of what your input into the workflow looks like and what you want the output to look like and I’m sure someone will be able to help you out!
Regards,
Martin
2 Likes
Hi, @MartinDDDD ,
My situation is as follows:
I have a CSV file:
MunicPopul.csv (237.0 KB)
It has one column per year and the respective municipal population.
I need a monthly estimate for each municipality. And the rest of the workflow is not very important here.
Can someone help me on adding 12 monthly columns for each year, for an input with intermediate values?
Thanks.
Rogério.
Hey there,
I had a look at the data set and noticed that your years are actually in rows.
I understand that you want 12 columns for each year that is in the rows (although not 100% sure - that why in general it is better to see an example of what your source data is and what you want to turn it into).
Here is my attempt of doing what I think you want:
Workflow:
12ColsPerYear.knwf (135.7 KB)
1 Like
Dear Martin,
I followed your suggestion (thanks for that…), and it worked out perfectly.
But the values for january are repeated in the subsequent monthly columns for each year, so that the same value is shown (as if it were static) along each whole year, as shown in this file:
MonthlyPopulBeforeInterpolation.csv (372.3 KB)
Next, what I need is to make a linear interpolation for intermediate months (Feb-Dec).
There are 132 monthly columns (along 11 years, plus 2 columns for municipalities name and code). I felt I could automate this process, using flow variables.
I started connecting the node “Column List Loop Start” to the output of Pivot node (which produced the table I just sent you in the above CSV file), and selected only the months from February to December of each year. Then, I executed the node, but (unexpectedly), this node selected the columns for January and February from the first year, and for January of subsequent years, no matter what I tried to change its configuration options.
I thought this interpolation could be automatedly done by calculating the difference between January of a given year and january of the subsequent year, dividing this value by 12, and adding this value to each monthly column, and then re-starting this calculation for the next year, using flow variables.
Can you help me with this task? It is not working for me (certainly due to a fault of mine…).
Thank you, Martin.
so let’s say Jan Year 1 is 200 and Jan Year 2 is 310 then you want to see the difference of 110 distributed evenly over Feb-Dec? e.g. 10 per month?
Do you want Jan each year to show the annual total and only remaining month to show the linearised growth?
There are definitely options to implement something like this, but I’d really appreciate for you to prepare an excel example of your desired output for at least a generic example from Year 1 to Year 2… this would be really helpful to take the guesswork out of the process and get to a solution quicker!
2 Likes
Hi @rogerius1st , Can you please mark post as a solution?
Hi, Martin.
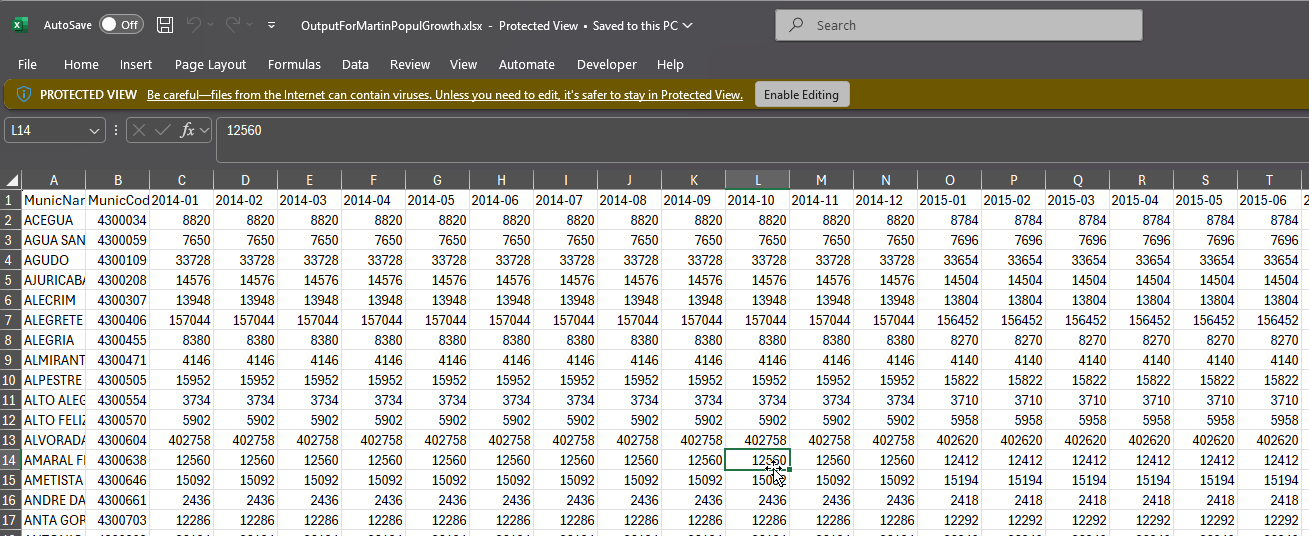
What I wanted is something like in the following file, except that the data are real just for the months of January, and the remainder months have the same repeated value.
OutputForMartinPopulGrowth.xlsx (209.6 KB)
BTW, these data are open. No trouble for sharing them here.
And yes, I am assuming that gross population is linearly distributed along the year.
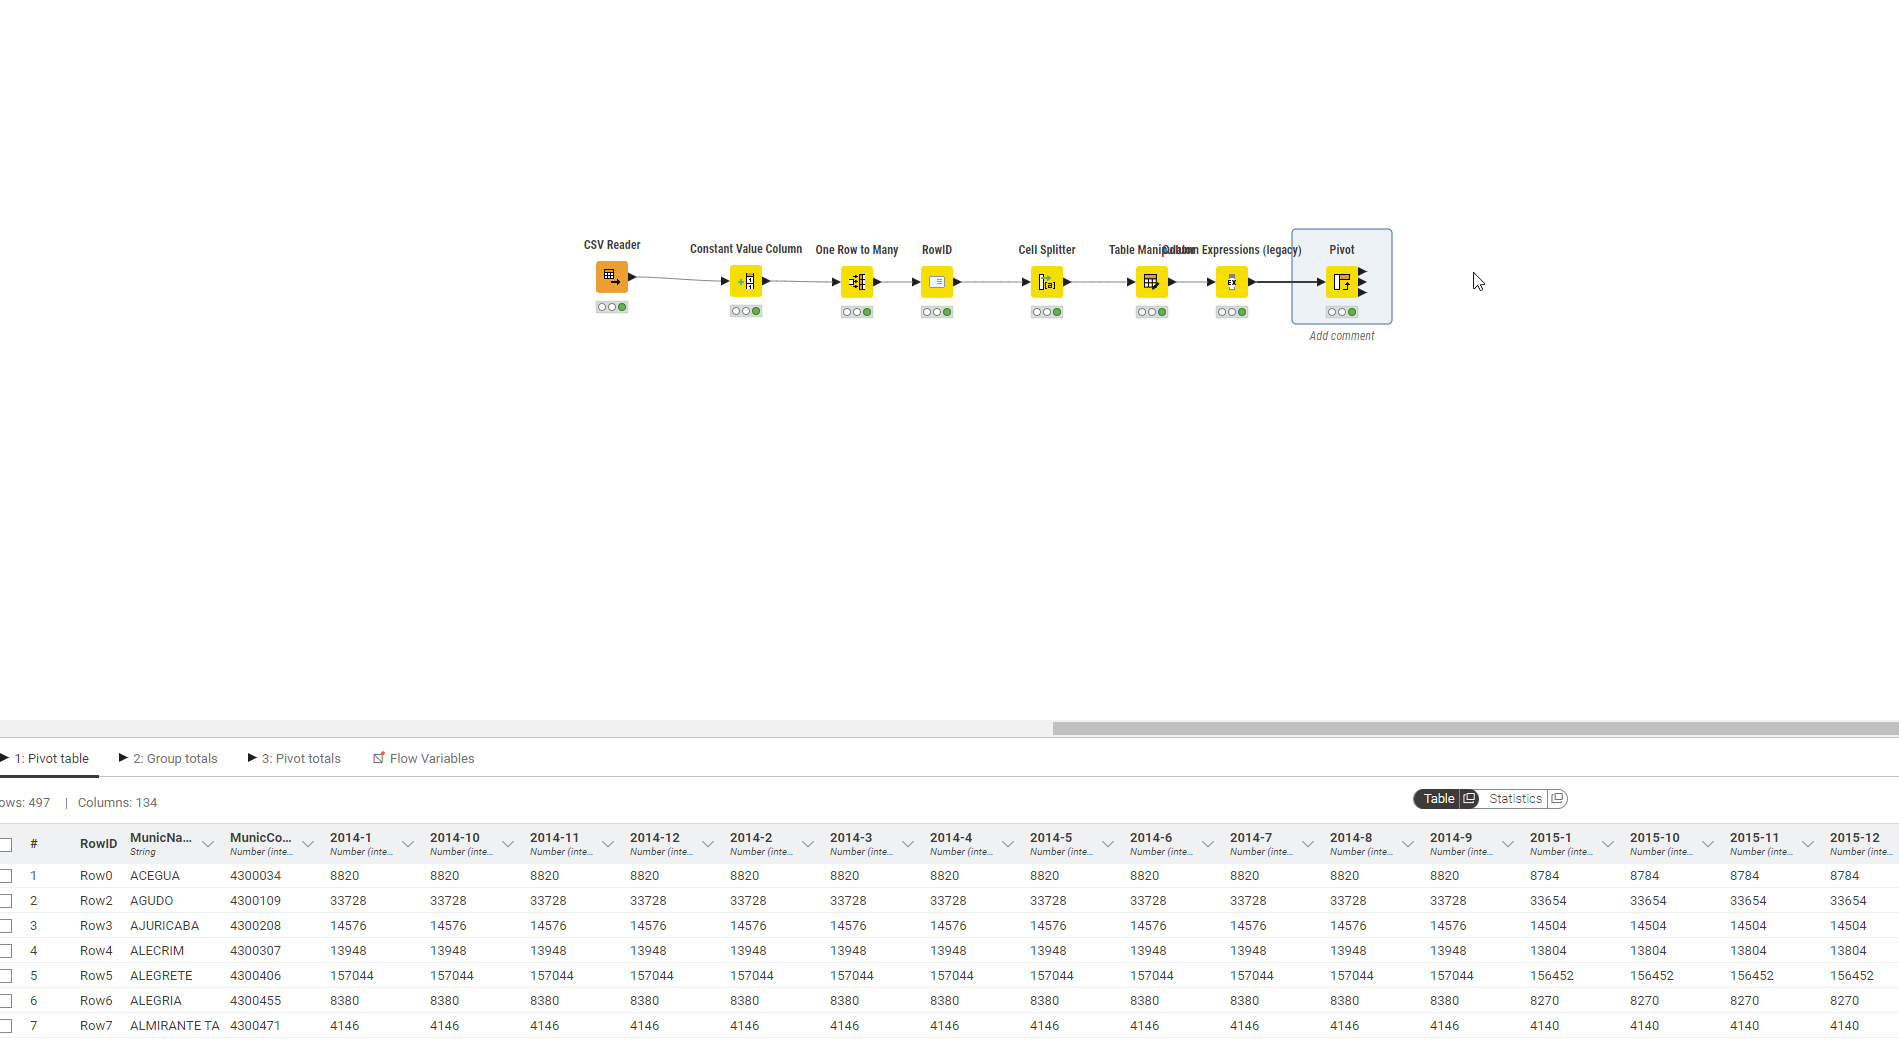
After pivoting into Knime, I got something like this:
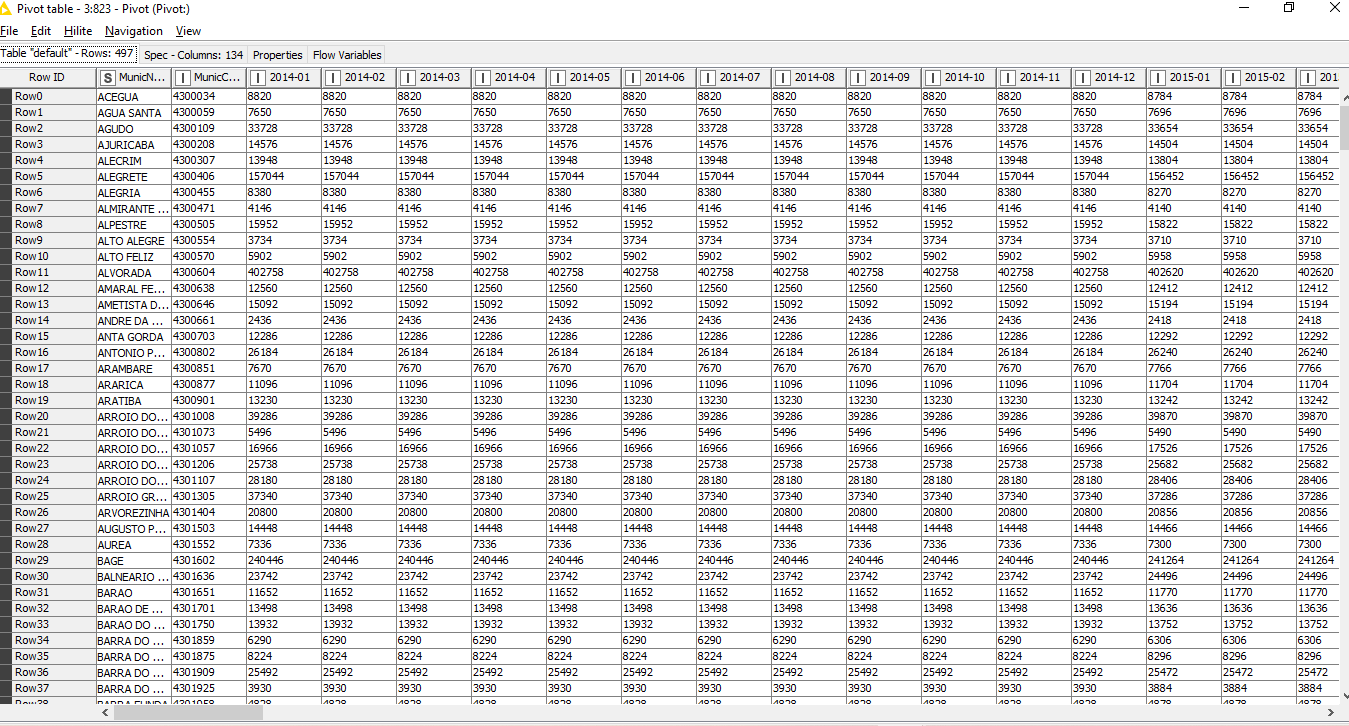
Considering that there are 497 municipalities, and 132 months, I wanted an automated path for building this timeline, estimating the municipal population in each month. And just the gross number of inhabitants woould be enough to proceed on my analysis. I’ve thought in using flow variables, but didn’t reach to build this part of the task.
Thanks, once again.
Rogério.
It is correct that the value right now just repeats what was in it for the year when it was one line.
As outlined in my last post - I just do not understand based on your written description what exactly you want to see - therefore I cannot implement a logic that meets your needs.
The excel you have uploaded in your last post seems to be the output of my Workflow.
What I need to progress and help further: An excel example that contains for just two consecutive years what you want to see once the workflow has run…
Image of the file I downloaded:
Dear @MartinDDDD,
Yes, I have used your workflow, and it worked out perfectly, except for interpolating intermediate months.
As you have asked me, I have prepared an Excel file, and I interpolated intermediate values (assuming a linear growth). Into Excel, I have used the functions “ROUND(formula)” and SEQUENCE (in my Portuguese version, they are named “ARRED(formula)” and “SEQUÊNCIA”), with the syntax:
=ARRED(C2 + ((O2 - C2) / 12 * SEQUÊNCIA(1; 11; 1; 1)); 0)
And then adapted this command to each year, because “O2” is the population for Jan-2015 and “C2” is for Jan-2014.
The only lacking data are for the final year (2024), but I will search for population data in the month of Januyary-2025 right tomorrow. Anyway, this is the Excel file with monthly population values:
OutputForMartinPopulGrowth.xlsx (484.2 KB)
Next, what I am still needing into Knime is:
- to calculate the difference between the value (gross n° of people leaving) in ACEGUA in January of 2015 and in January of 2014 (and similarly for subsequent years);
- to divide this difference by 12;
- to multiply this fraction by the number of the following 11 months;
- to add this result to the original value in each cell, assuming the populational growth was linear;
- to round this number to integers.
Then, to do similar operations for the following years, and for the remainder municipalities. Of course, I want to do these operations automatically. This is why I thought in using flow variables.
If I haven’t provided you with enough information and details, please let me know it, right?
Thank you once again.
Rogério.
I see - thanks a lot for that example - now I get it - calculate the difference between two years and then the show the cumulative total.
I will look at it this afternoon - that is definitely doable ![]()
Hi,
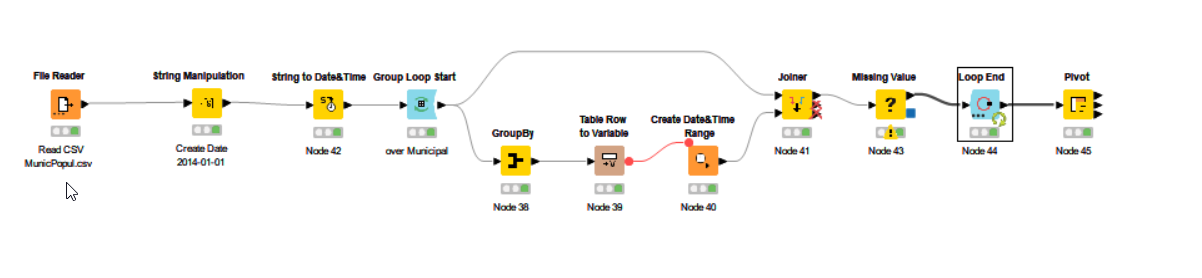
you can use the “Missing Value” Node to do linear interpolations, even on date/time columns.
So I:
- read in your CSV,
- create a date column using the “year” column with string($year$) + string(“-01-01”)
- convert it to a date
- loop over every city in your table
- get min/max of the dates
- convert these to variables to start/end
- Create Date Range using these variables
- Join tables to get population at begin of year
- use Missing Value Node to interpolate
At the end you can use the Pivot Node to reshape the table to the desired monthly columns
3 Likes
I see Andy already provided something that looks like it solves it - for completness sake here is my stab at it using Expressions nodes to get differences between rows and to linearise it and then lag node / moving aggregator to calculate running total per group.
A little messier than normal - greetings from the train to KNIME Summit in Berlin ![]()
12ColsPerYear.knwf (243.0 KB)
1 Like
Dear @ActionAndi ,
Thank you for your help.
- a very interesting idea of using the node “Missing Values” to create 11 empty rows and to interpolate intermediate numbers.
I applied your workflow, but: - into the loop, at the node “Create Date&Time Range”, configuring its interval to 1M (instead of applying an End to the time range), and limiting to 1000 rows, it produces dates until the year of 2097 (i.e., 1000 rows / 12 months = 83.33 → 83 + 2014 (initial year) = 2097, instead of finishing the loop in 2024.
- Starting in 2024, the population values keep the same.
- This loop generated data (collected in the node “Loop End”) in a table with 497000 rows.
Hi @rogerius1st,
yeah good catch: There’s an error in the config of the “Date/Time Range”.
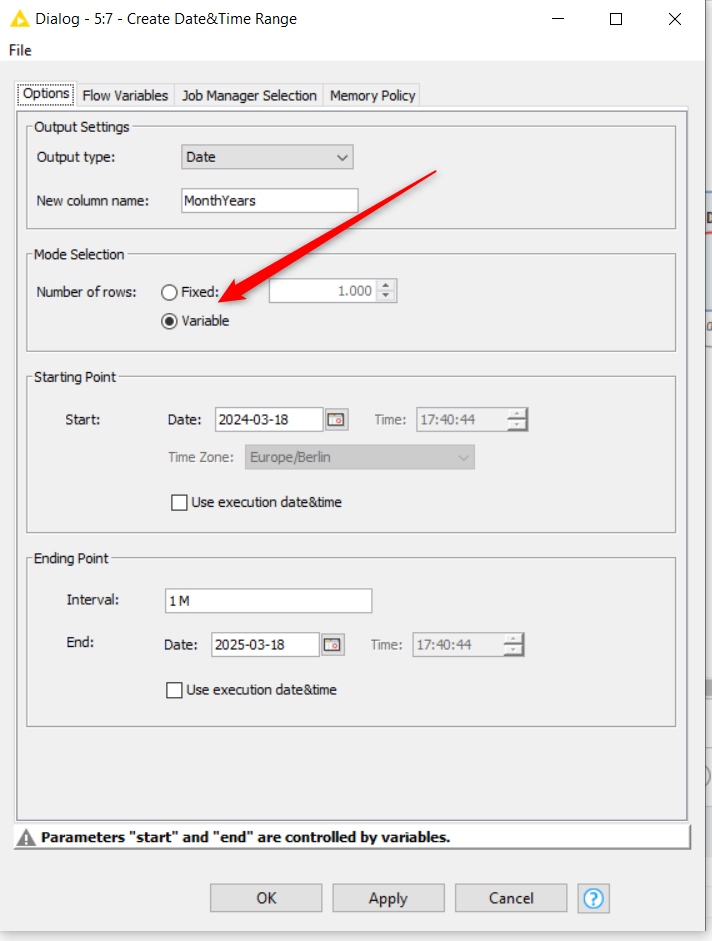
You have to set this Mode selection to “Variable”.
I added another way without looping to my workflow.
2 Likes