Hello KNIME members,
I am struggling with making histograms in KNIME. The following histograms I need to make in KNIME(done in excel):
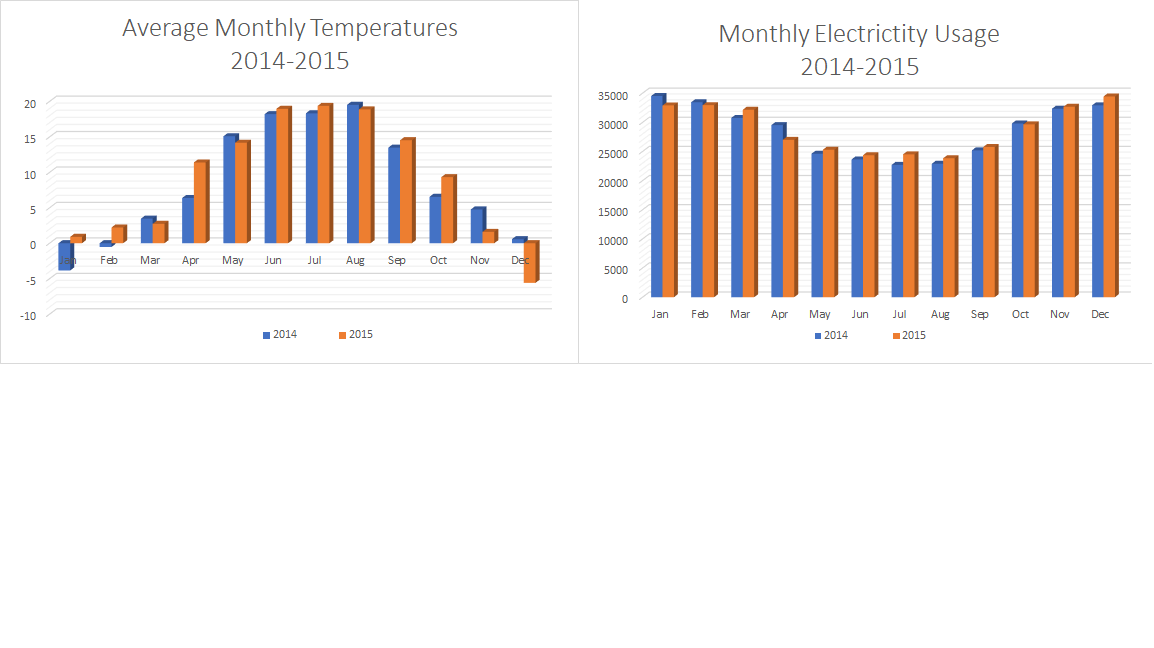
On the x-axis i need to have the months and on the y axis I need to have the temperature for one histogram and electricity usage for the other histogram.
To do this I have the following datasets (included in the ZIP file):
Datasets.zip (63.8 KB)
To explain the datasets a bit more:
Dataset 1(“data”): Contains the electricity load each 30 minutes in years 2014 and 2015. Each row corresponds to the data of one day. Columns 1, 2 and 3 indicate the year, month and day of the measurements, respectively. The remaining columns show the electricity loads in 30 minutes blocks on that day. More specifically, T1 denotes the load of period 00:00-00:30, T2 00:30-01:00, and so on, and T48 is the load of the last 30 minutes of the day, i.e. period 23:30-00:00.
Dataset 2 (“Temperature”): Contains the average daily temperatures from 2012 to In the data file, the first three columns contain the information of year, month, and day, respectively. The last column indicates the average daily temperature in °C.
My question is how can I get this working in KNIME? I am able to load the CSV files in KNIME but then?
Thank you in advance!