Hi,
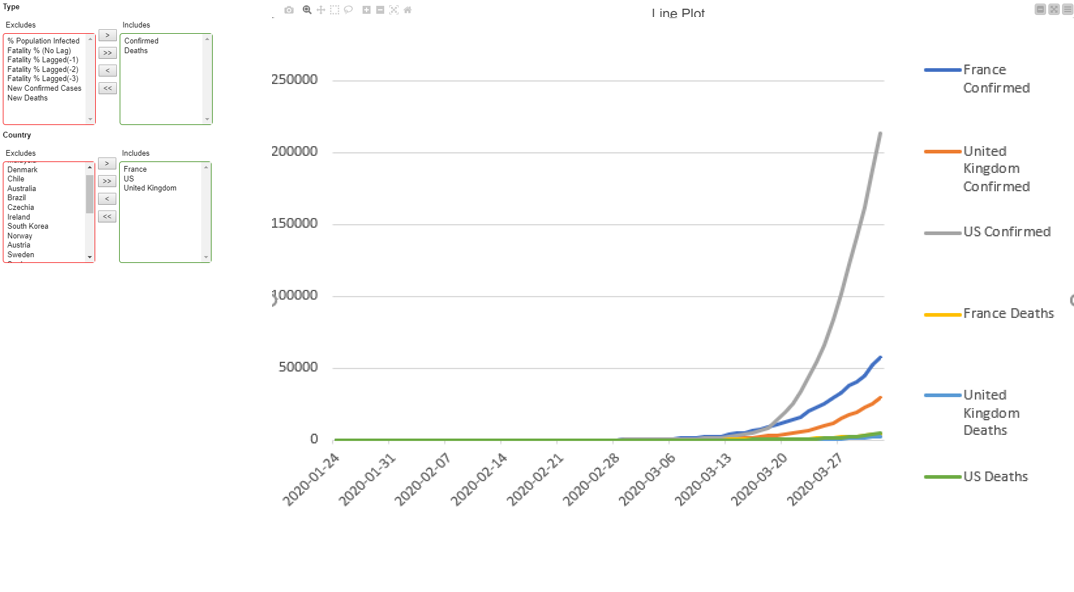
I am trying to build a component visualization using “Line plot (Plotly)” and two “Interactive Value Filter Widgets”
I’d like users to be able to select different countries and metrics (cases/deaths) from inside the component view, but I am struggling with getting it setup.
Hi,
I would like to have a look, but the data file you are reading at the beginning is missing, so I cannot execute the workflow. Could you share this as well?
Kind regards,
Alexander
Hi,
this does not seem to be the same data you had in your other workflow. The nodes in the component are configured with far more columns than in the Excel file you attached. Could you share that table file “COVID Data For Visualization.table”?
Kind regards
Alexander
Hi,
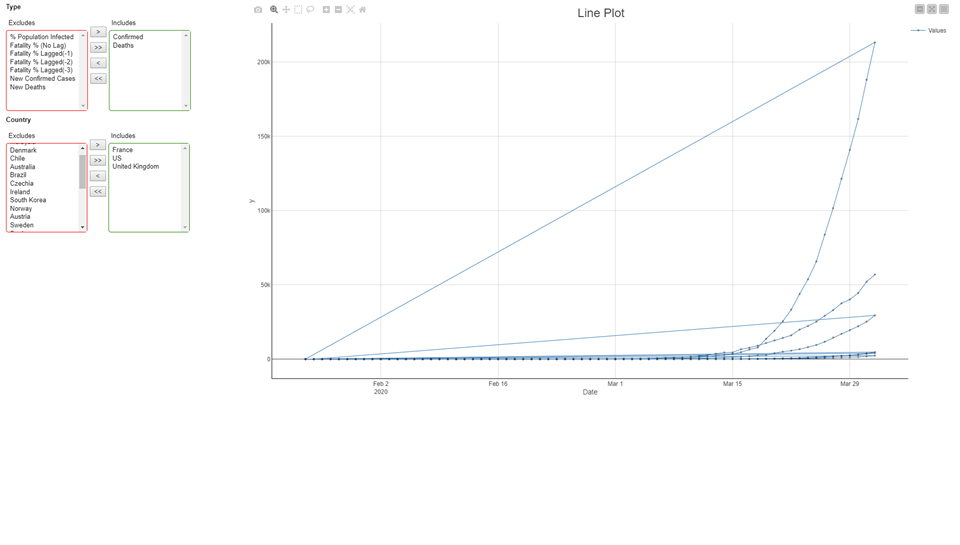
this is unfortunately not possible because you will need a Pivoting node in between the selection and the plot. In the Pivoting node, you need to set Date as Group Column and Country, Type as Pivot Columns and Aggregation First() for Value. If you split your component into two: One for selecting the countries and types and one for the line plot, this works.
Kind regards
Alexander