I am working with KNIME and trying to create a stacked bar chart that shows the distribution of males and females across different departments in my company.
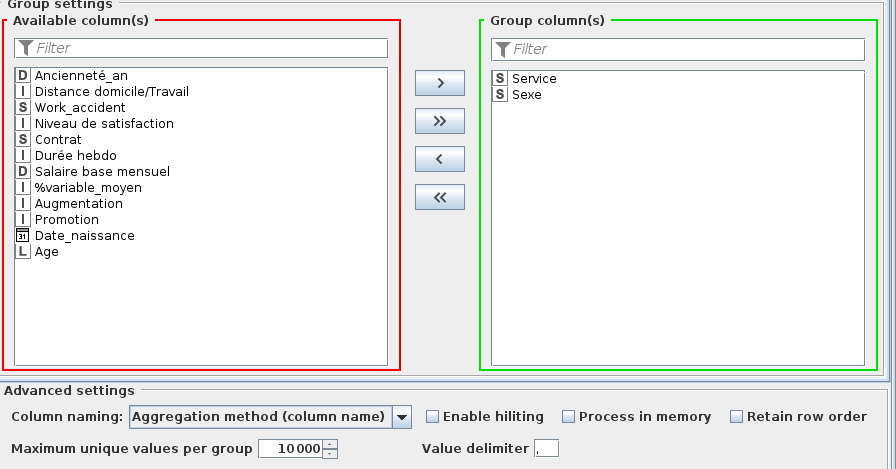
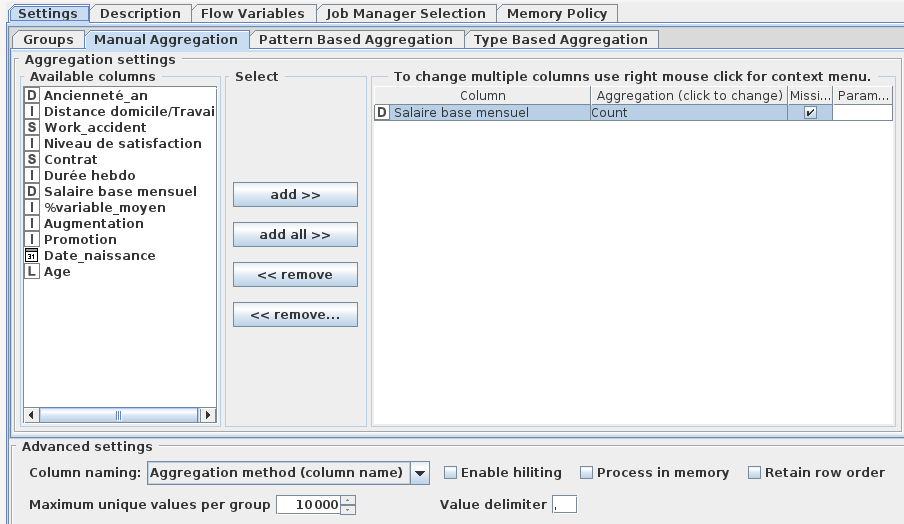
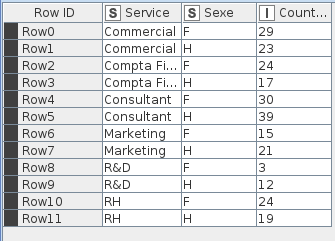
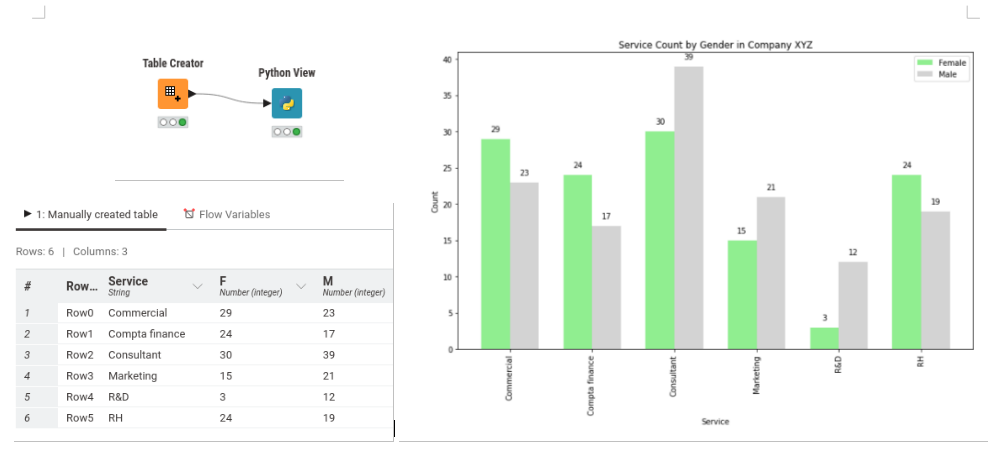
Here’s a snapshot of my DataFrame after applying a GroupBy node:
insert screenshot here
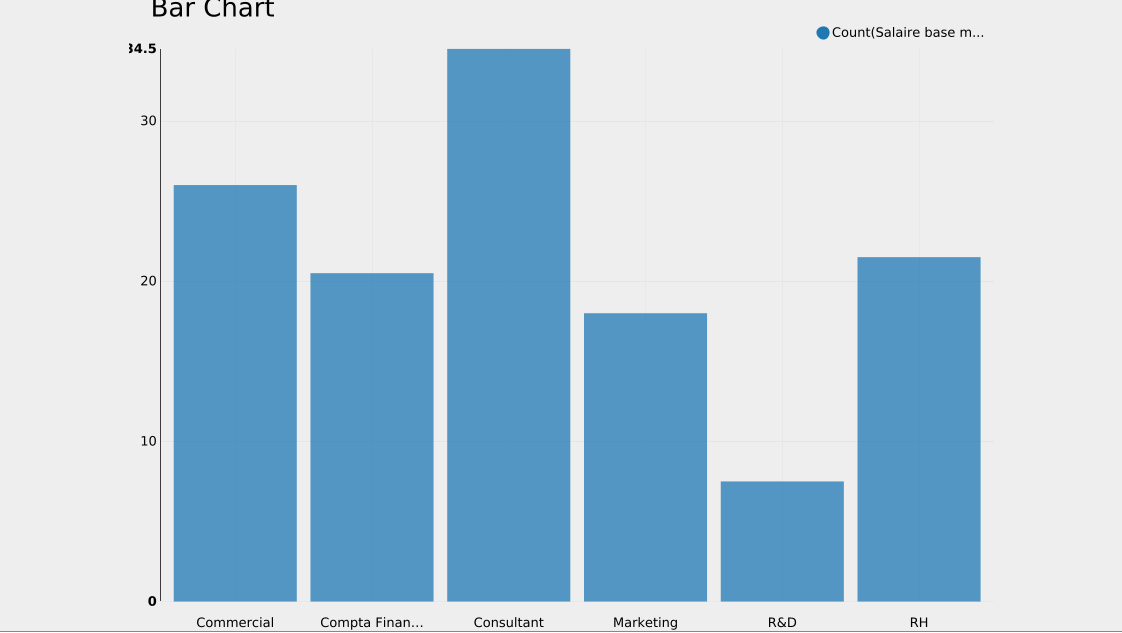
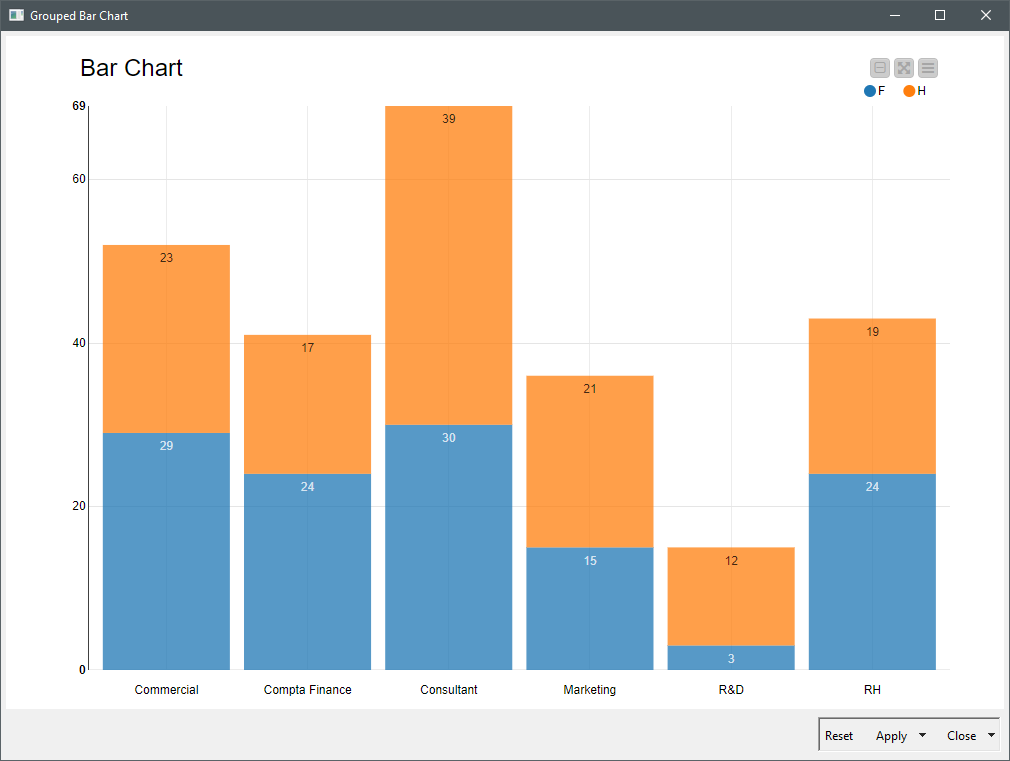
I would like to transform this data into a stacked bar chart where each bar represents a department, and the bar is split into two sections (one for males, one for females) based on the count of each gender in the department.
However, I am not sure how to achieve this in KNIME. I cannot find suitable options in the “Bar Chart” node. Could someone provide guidance on how to accomplish this?
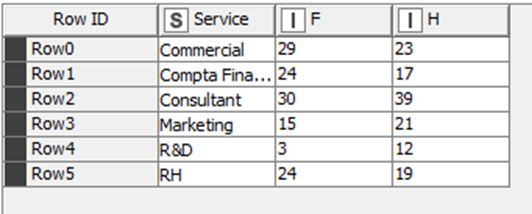
You are almost there as there’s is just a question of data shape; You will have to pivot your $Sexe$ column and feed the chart with two column value.
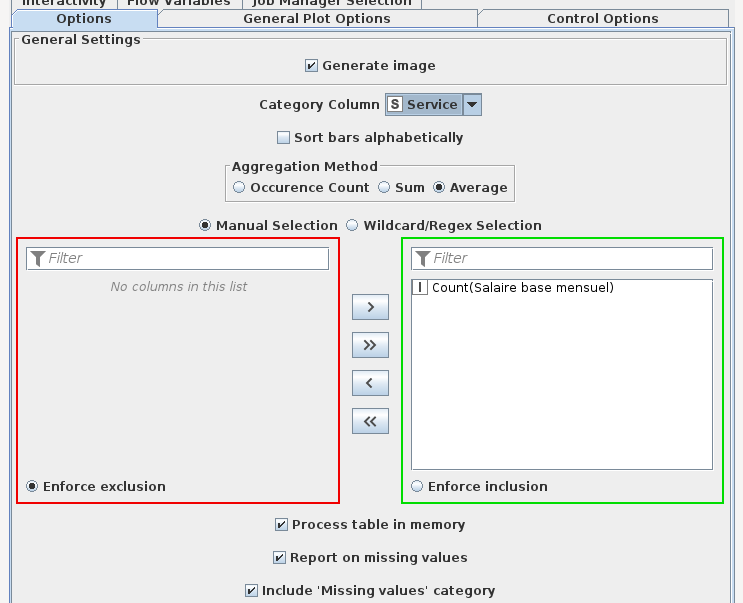
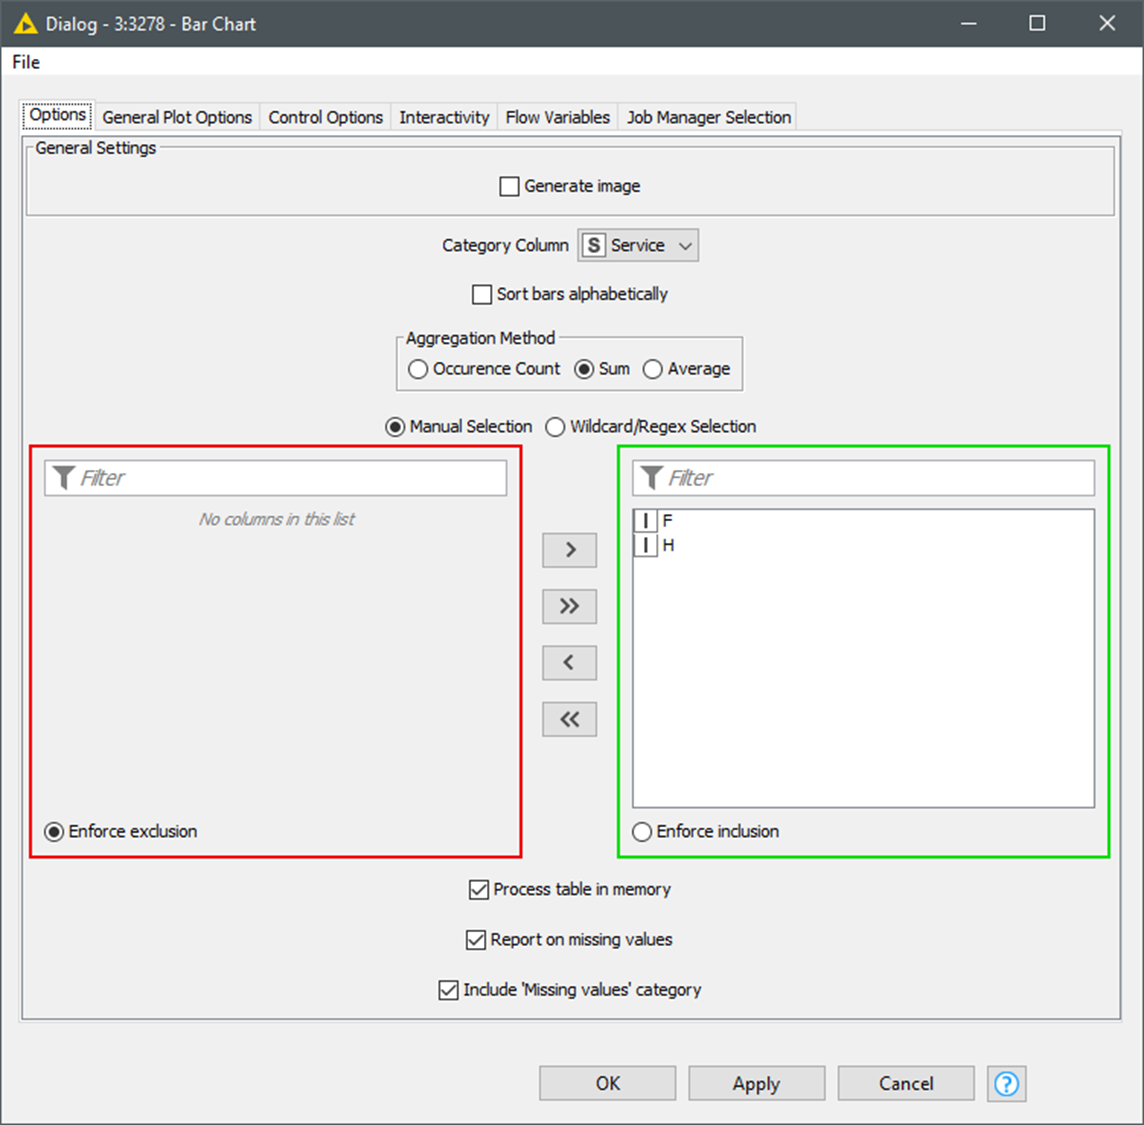
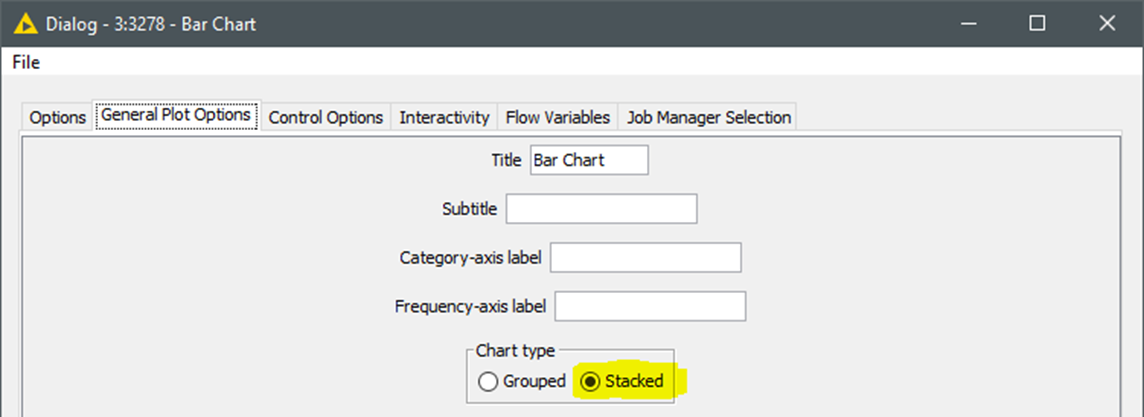
And configure your Bar Chart node as follow. Avg. and Sum will perform identical output in this case (one value per row/service). And you have to select ‘Stacked’ option in ‘General Plot Options’ tab.
In the case you want to represent full 100 stacked percent bars, the configuration would be exactly the same but, you will have to compute the percent values per row/service.
I hope this helps you to achieve the desired result.
bar_width = 0.35
index = range(len(categories))
plt.bar(index, female_data, bar_width, label=‘Female’, color=‘lightgreen’)
plt.bar([i + bar_width for i in index], male_data, bar_width, label=‘Male’, color=‘lightgrey’)
plt.xlabel(‘Service’)
plt.ylabel(‘Count’)
plt.title(‘Service Count by Gender in Company XYZ’)
plt.xticks([i + bar_width/2 for i in index], categories, rotation=90) # Adjust the position of x-tick labels
plt.legend()
Adding values inside the bars
for i, v in enumerate(female_data):
plt.text(i, v + 1, str(v), color=‘black’, ha=‘center’)
for i, v in enumerate(male_data):
plt.text(i + bar_width, v + 1, str(v), color=‘black’, ha=‘center’)