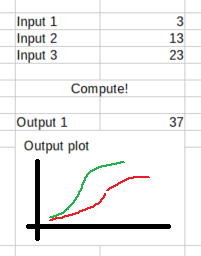
I was impressed by the youtube video " EXCELst Du noch oder KNIMEst du schon?" and now I wonder if it is possible in Knime to create an Excel-like GUI/dashboard. What I mean is: I would like to have a GUI or dashboard with some input fields, a “compute” button, and some output fields, something looking like this:
Is it possible to create something like this in Knime? If yes, what would be the recommended approach?
I do this by doing all of the heavy lifting in KNIME and then using the Excel Write to Template node to write to excel for presentation. I recommend changing the presentation to placing graphs, user adjustment fields above or to the side of written data for simpler implementation.
That node will leave all formatting and graphs in place and just update the data.
Thanks iCFO for the prompt reply, but I don’t get how the “Write to Template” node can handle the “input” part, how does the user select the input values?
You can create drop-down lists, toggle settings, number entry areas, charts, etc on the excel end. Point those calcs to to the data that is updated and overwritten via KNIME.
My preferred approach is to write the table from KNIME into excel 20 or so rows down using the advanced tab in the Write to Template node. Then I create my dashboard display and calcs above it. That way it starts with the summary and dashboard settings, and has the table detail below with space for writing any number of rows. You can also write the KNIME table to another tab if they don’t need to see it for reference when working.
To be clear, my Excel suggestion is for an easily shareable “dashboard” for non-KNIME users. You can also build a component within KNIME to function as a dashboard as an interactive view within the workflow itself. However, it can only be shared with other users by giving them the entire workflow to run locally or by uploading it to KNIME business hub if you have a paid license.
Creating a component based interactive dashboard is definitely going require some KNIME skill development. How much is going to depend on the goals, process and visualization of your dashboard design. If your company has a KNIME business hub license then there are likely some users that can help (along with the forum). Here is a starting point for understanding dashboard construction in KNIME.
Basically you wrap all of the visualizations, configuration settings and widget parts into a component, then arrange the combined interactive view at the component level.