I have 3 tables, with latitude and longitude of objects.
I want to create a heat map to see the correspondence between the locations/regions of the 3 table data.
How do I need to build my workflow so that I can create a heatmap?
I want the latitude as the x-axis and the longitude as the y-axis.
let me try to give you a hint. If you can, try to share some data so that everyone can help you better.
What I would do is the following:
Concatenate all three tables (columns: lat, lon, name of table);
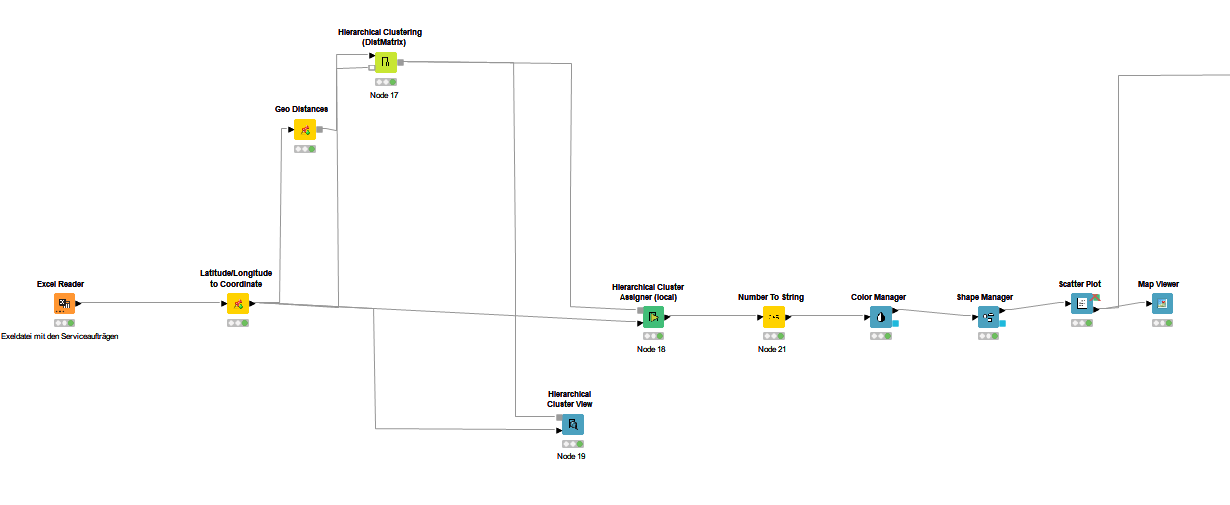
Use a Shape Manager node to assign a specific shape to rows belonging to the three tables (ex: table 1 → circle, table 2: square, table 3: triangle). You can use a Color Manager node too
Use the OSM Map Viewer node (other nodes might be available). Make a connection just like in the example in the link below.
Hope it can help - if you need more help, I can help at 18:00 ECT.
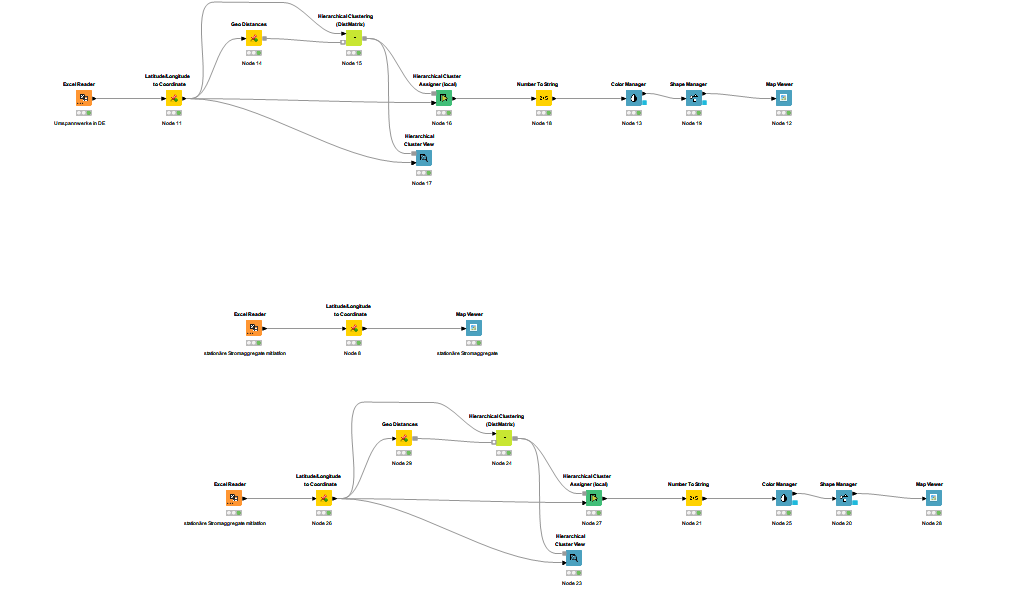
Have a look at this workflow. Is it working for you?
If yes, mark the post as solved.
If no, please upload a workflow (not an image) so I can better understand what is not working from your workflow. I cannot understand where the error is from the image