Hi friends:
I need to graph this values
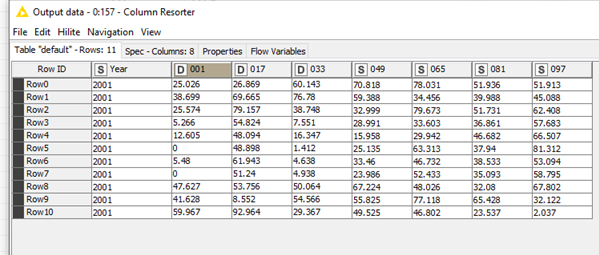
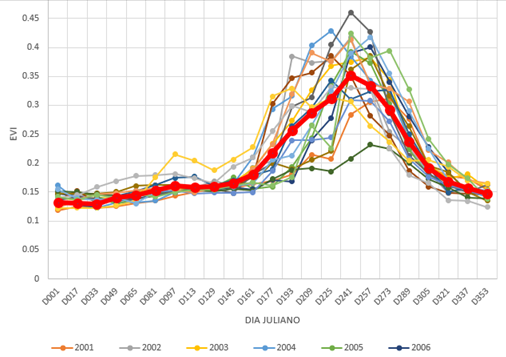
And generate this graph or similar
i am dealing with line plot but not graphic
NDVI_TAMP_I.knwf (16.8 KB)
regards
Hi friends:
I need to graph this values
And generate this graph or similar
i am dealing with line plot but not graphic
NDVI_TAMP_I.knwf (16.8 KB)
regards
Can you post the csv file your workflow reads?
sorry,
this is the NDVI_TAMP1.xlsx (3.9 MB) xlsx
thanks
Hello @jijasmx007,
so you have to organize your data a bit differently. Years need to be columns and current column names need to be all in one column. Take a look at this example and modify it according to your needs. Additionally you have id column (fid_1) which I ignored and calculated mean over 001, 017, 033… to represent data in a Line Plot.
2020_12_03_LinePlotYearsExample.knwf (3.9 MB)
Br,
Ivan
@ipazin
Thanks for helping me so much
This topic was automatically closed 7 days after the last reply. New replies are no longer allowed.