I have a relatively large database (600k+ rows) with transaction data for a (fictitious) online bookstore. For the purpose of this question I’m only concerned with 2 columns: 1. Date and 2. Price
I have already converted the Date column from string-to-datetime. The datetime stamp is formatted yyyy-MM-dd HH:mm:ss.SSSSSS for all the transactions over a 2 year period (hence the 600k+ rows…).
I now want to group these transactions per day (basically ignoring the time stamp) and sum the Prices for each day.
When I only use the groupby node I can’t specify that I want it to be per day (or month, or year).
Which node(s) should I use to be able to solve this?
The next step is to create a line plot of this data, i.e. a time series plot. How do I then tell the line plot to use all 3 (day, month, year) on the x-axis?
Is there a way to create a DateTime out of the 3 individual columns?
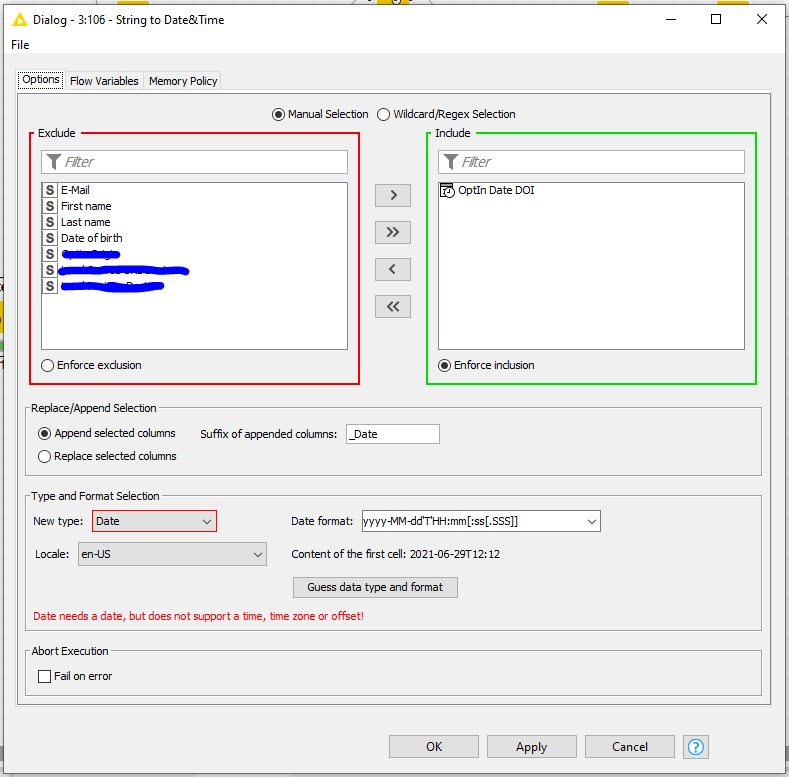
you might just extract the date out of date&time.
Therefore, just place another String to Date&Time, choose your Date&Time column and force “Date” as New Type.
It’ll extract the date.
Thanks, I think this would have worked if there hadn’t been times with format yyyy-MM-dd HH:mm:ss.SSSSSS as well as times with format yyyy-MM-dd HH:mm:ss.SSS
No matter how I configured it, using [___], it always excluded some of the dates.