Hi,
I’m currently working on a sentiment analysis project, where my goal is to perform sentiment analysis with ML on tweets with good acc score. I collected around 18 000 tweets and labeled them into four categories; positive, negative, neutral, and mixed. Basically a multiclass classification problem. But I have bad acc score with SVM, Decision Tree, and XGBoost. I tried using SMOTE for minority classes for my training data, but still does not perform well.
Does anyone have a good suggestion on what I can do to improve my scores or any tip regarding other tools? My acc is between 0.6-0.65
With the amount of information given, it’s quite difficult to give any constructive advice. Here’s some questions for further reflection and some hints:
How’s the categories distributed?
What’s the baseline accuracy based on that distribution? What accuracy can you achieve by just predicting the most dominant class?
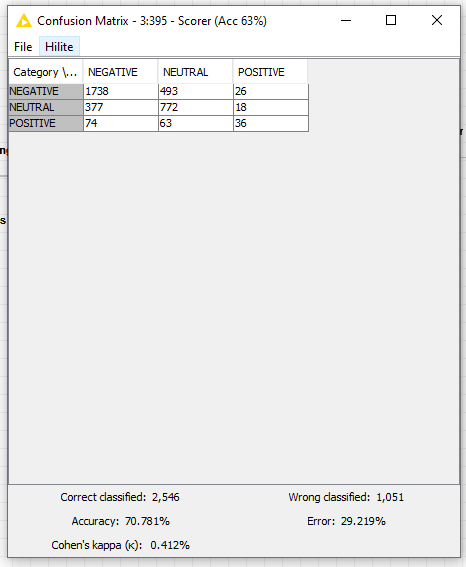
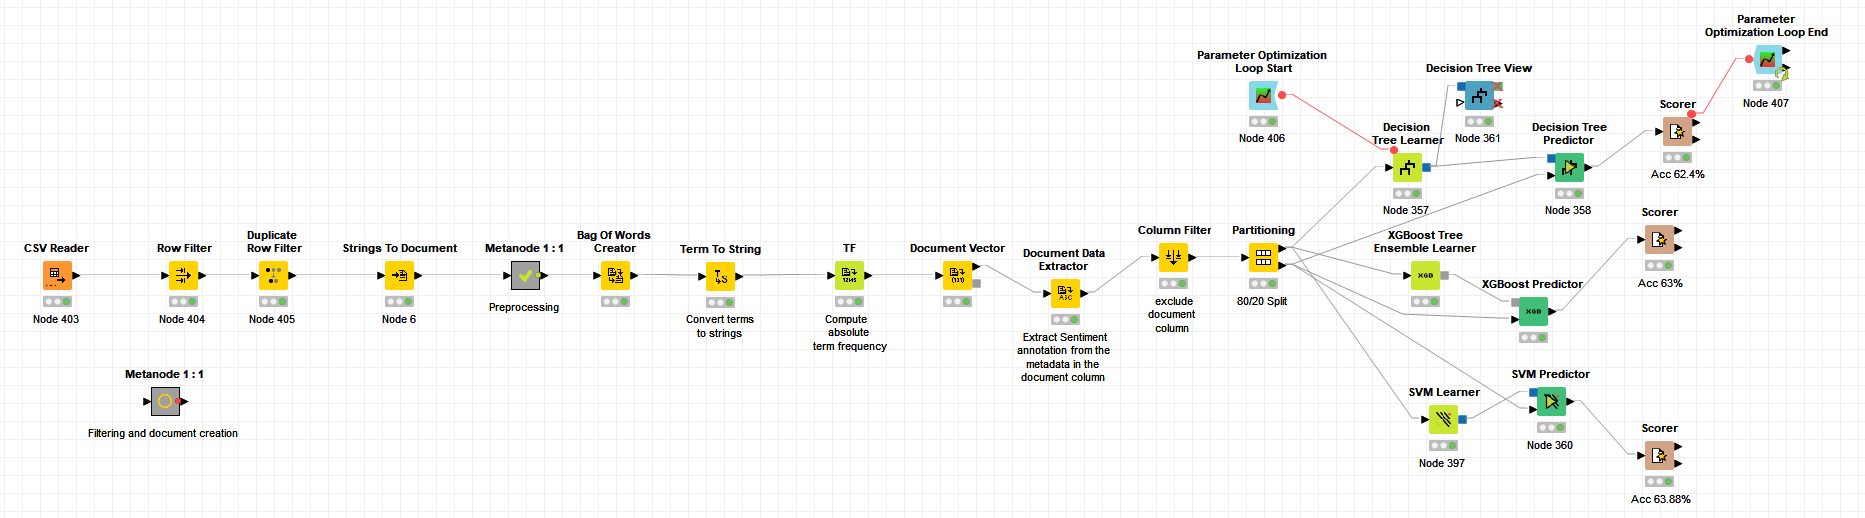
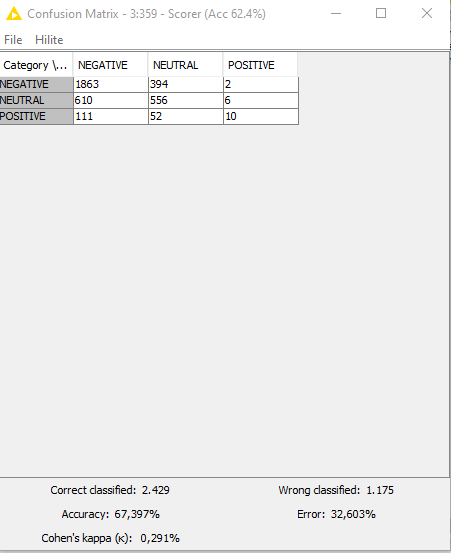
How does your confusion matrix currently look like?
“Neutral” and “mixed” are probably hard to classify – how’s the results if you limit to positive / negative only? Maybe you can reduce this to binary classification and use the classification probability to deduct neutral/mixed.
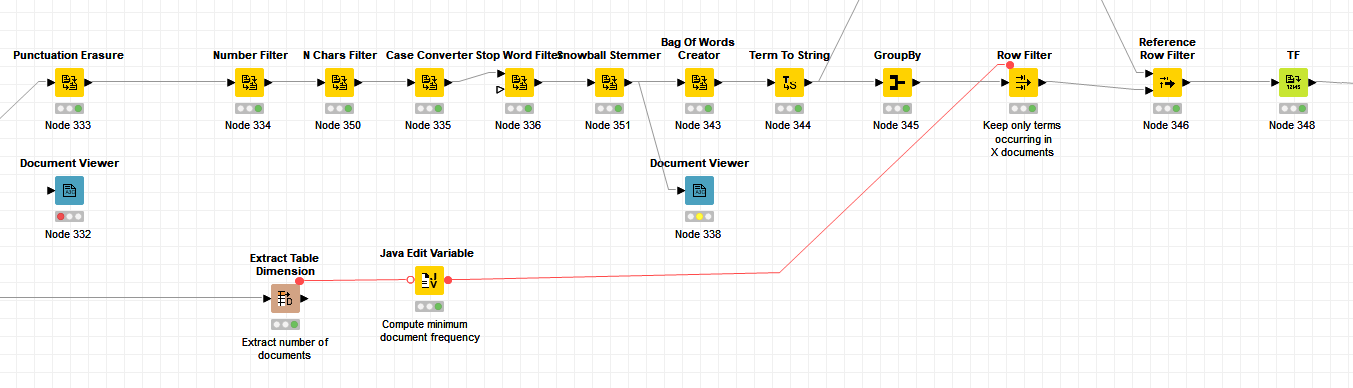
What preprocessing do you apply? Tweets are quite special, typical NLP preprocessing will likely not get you very far
Additionally to what you have, definitely have a look at the Palladian Text Classifier which has various simple preprocessing methods (char and word n-grams) and a simple Naive-Bayes-based scoring. It can get you quite far (especially compared to the tuning which you have to invest in conventional text classification workflows)
You say you have a multi class setup? How do you use the ROC curve?
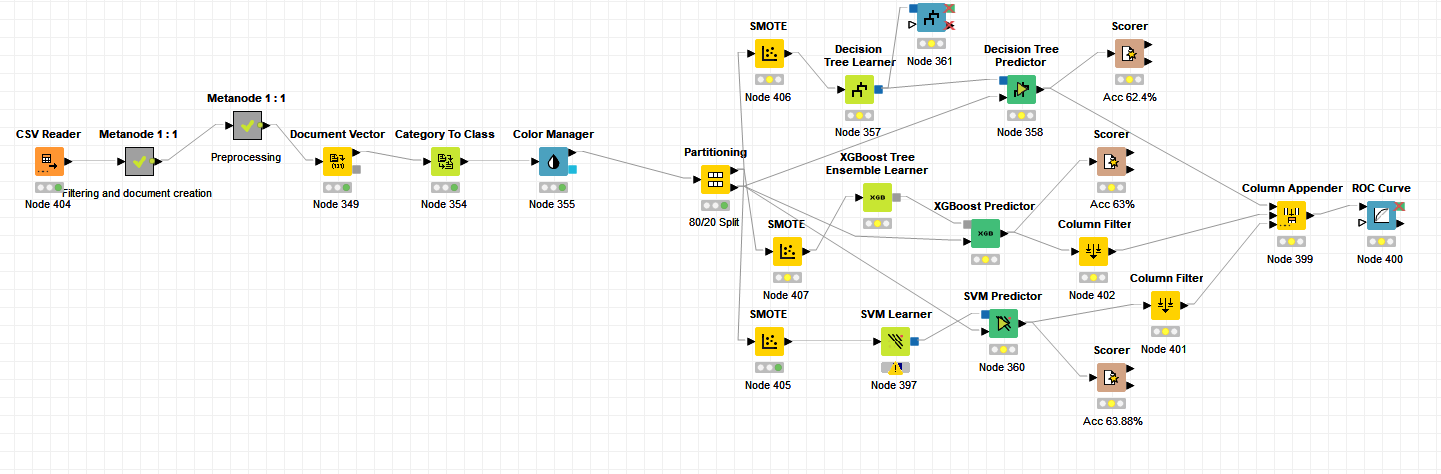
I followed the Kaggle US airlines workflow to create a predictive model for supervised machine learning.
When it comes to the ROC curve, it was from an earlier test that I forgot to delete from my workflow. Do you have any suggestions on what I can add something similar for multiclass classification for visualization?
I will try to limit only to positive, negative, and neutral. If I limit only to pos/neg my dataset will be highly unbalanced since the majority of the tweets are negative. I’m also wondering if there is an easy way to filter out mixed category from my csv, since I have a header named sentiment and the rows represent the classes.
I forgot to mention that almost 10 000 tweets are labeled as Negative, 1000 as Positive, and 5000 as Neutral. My acc with three classes, pos, neg and neutral
Anyone?
I tried two different workflows, the IMDB dataset workflow with ML and US airlines workflow, and replaced them with my own dataset. Since I work with tweets, which one should I follow? The preprocessing methods are different. Most workflows also use loops on the ML part, what is the purpose of this and does it have any benefits? One last thing, when inspecting the scorer, correct classified and wrong classified sections don’t add up with my dataset. Shouldn’t the sum of these be around 18 000? My data is highly imbalanced