How to set minimum and/or maximum values for axes in scatter plot manually ?
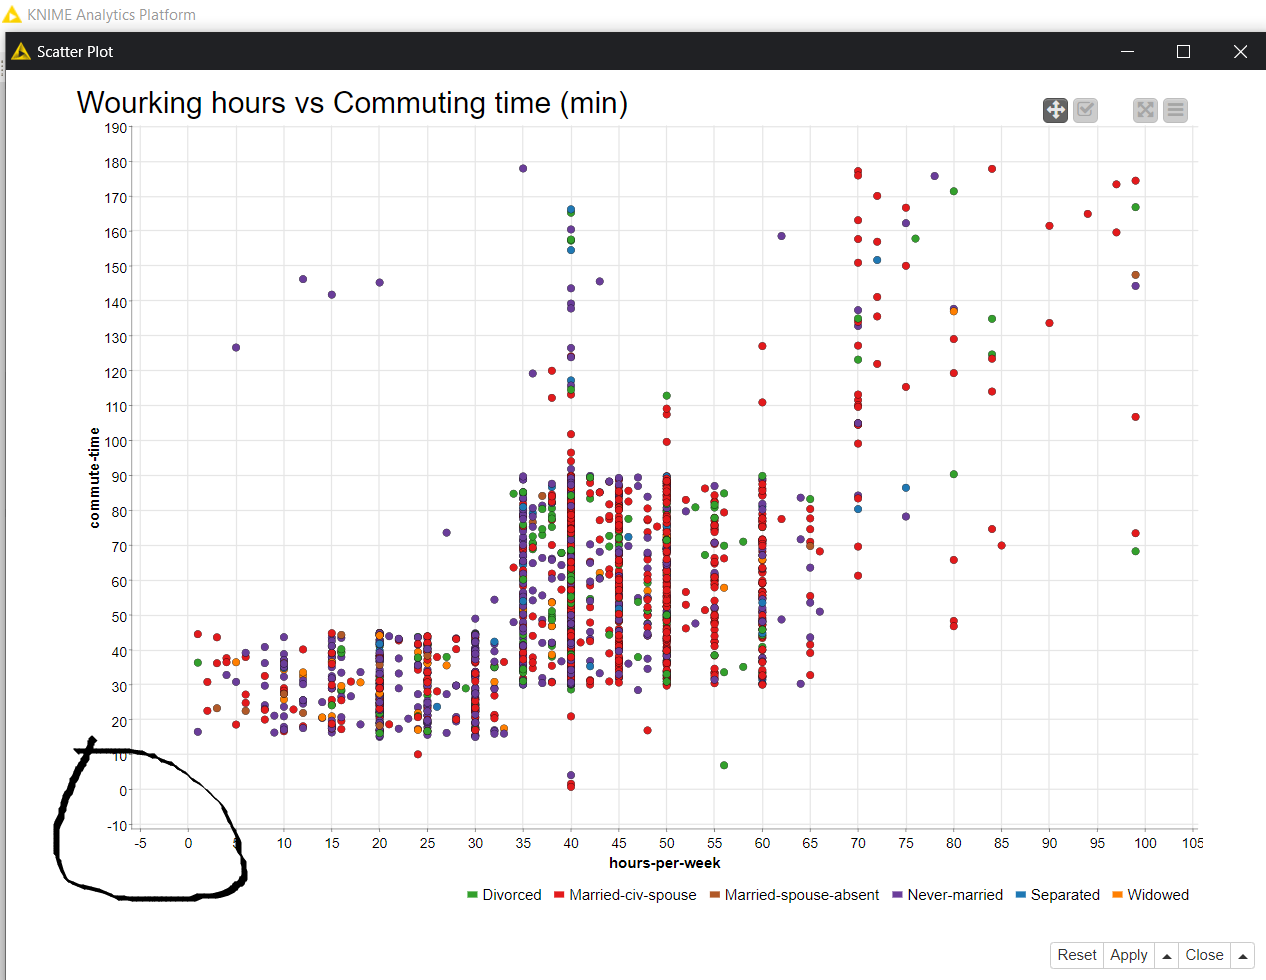
I am going through the self paced course ( [[L1-DS] KNIME Analytics Platform for Data Scientists: Basics] - Part 17 Visualization). The hands on exercise and its solution show a scatter plot with axes having negative values. It would be good to set axes to start at zero. Any suggestions ?
Hi @kunalsaha and welcome to KNIME Community Forum,
The axes start from a lower value (and end in a higher value) so the data points can be displayed better. You can select “Use domain information” in the node configurations > Axis Configuration tab to limit the axes range to attributes’ domain.
Hi @armingrudd … Thanks for the quick response. I did find the “Use domain information”, but not the place to actually set the values. PFA the screenshot. Please advise.
You can use the Edit Numeric Domain node to change the domain of a column: That’s the domain information that is also used by the Scatter Plot, for instance.