Good Evening to everyone,
I am working on some time tracking records of my personal daily activities.
I prepared a minimal example to show you the structure of the dataset:
Time Tracking Minimal.knwf (70.8 KB)
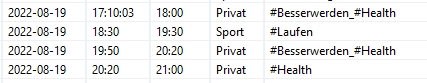
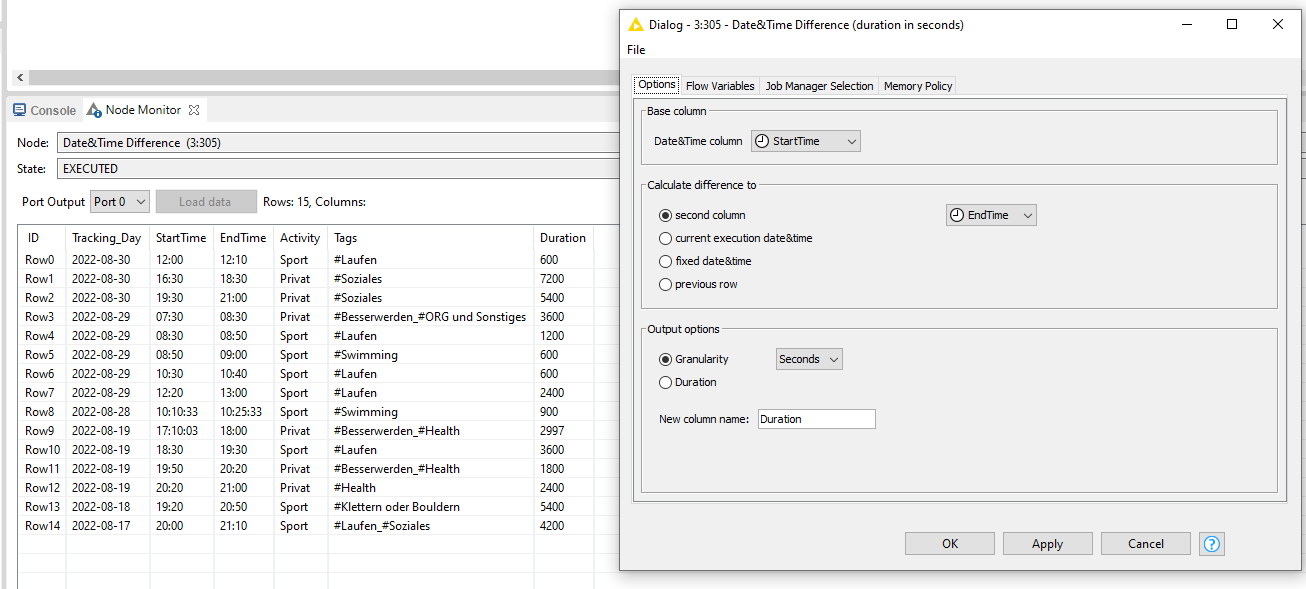
As you can see, each row has a Tracking_Day, Activity, Tags and Duration. For the tags, I am using up to four as a maximum in the full data set. In My minimal example, there are maximum two tags in the columns Row3, 9, 11, 13 & 14.
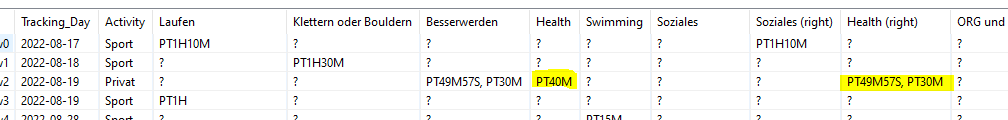
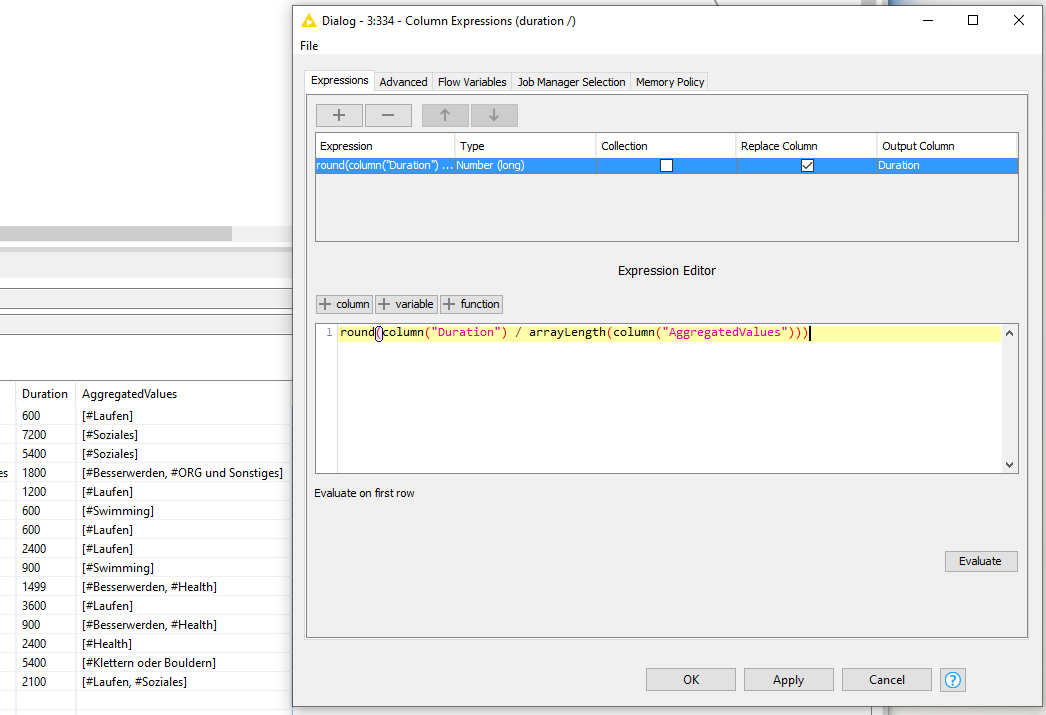
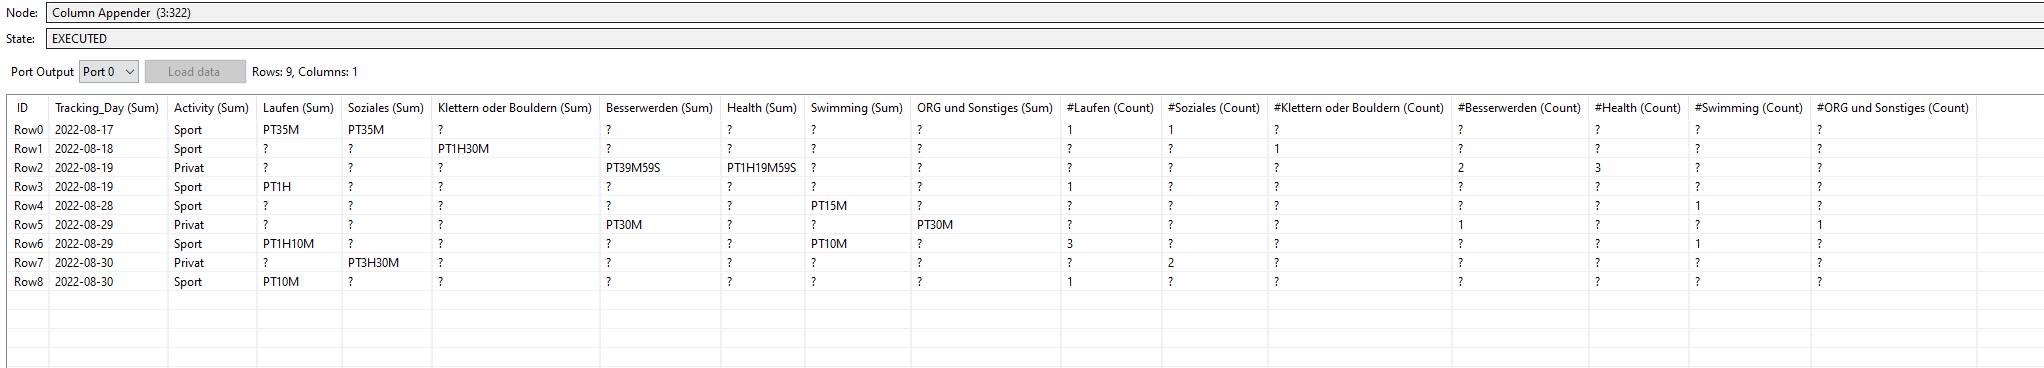
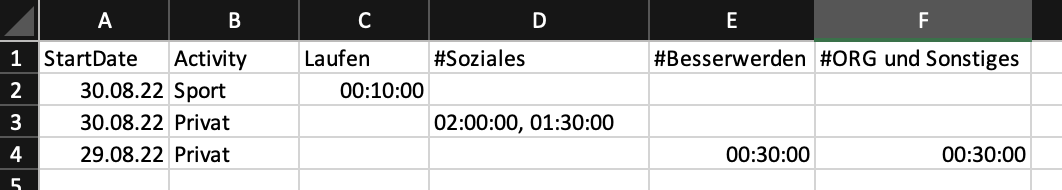
I would like to have at the end a table which has the Date and Activity separated, and the Tags pivoted with the Duration divided to each Tag (if a tracking has three tags, it will be divided by three for each tag column).
For example, the first 4 rows could look like this (of course differently formatted, just tried to put it to excel to show what I mean):
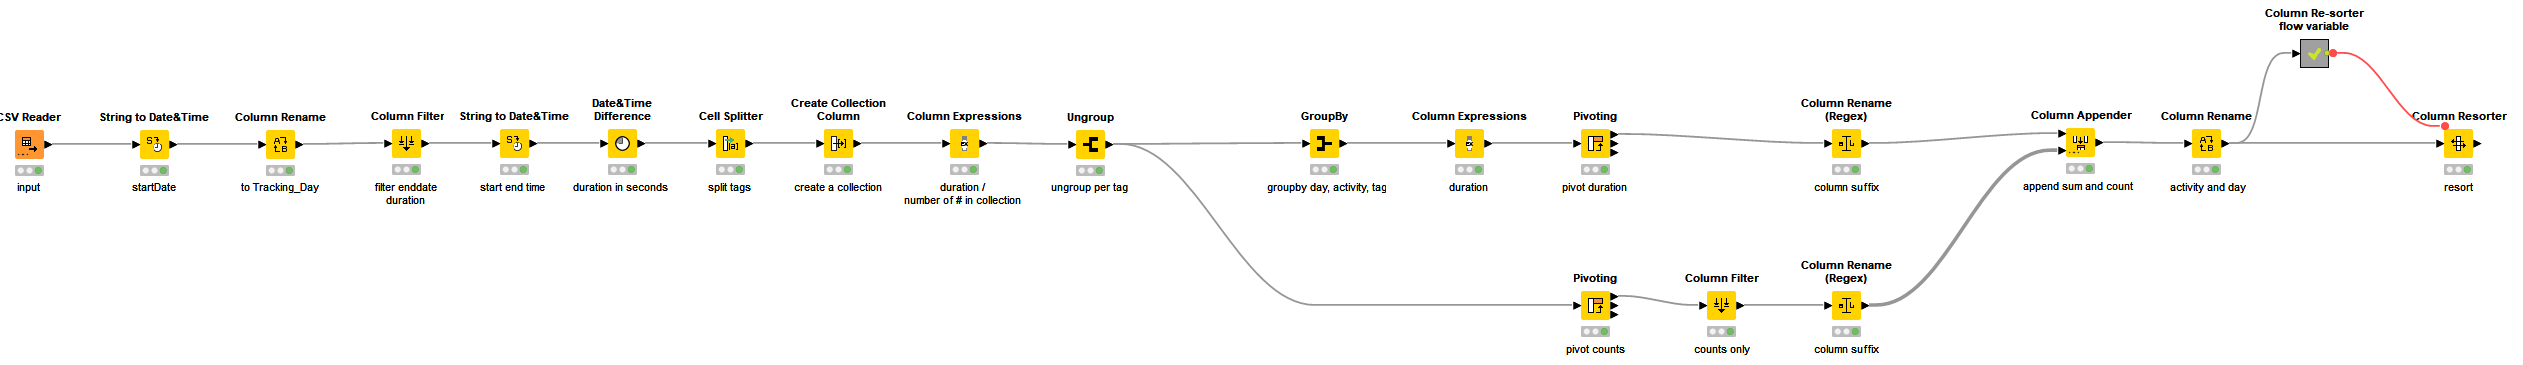
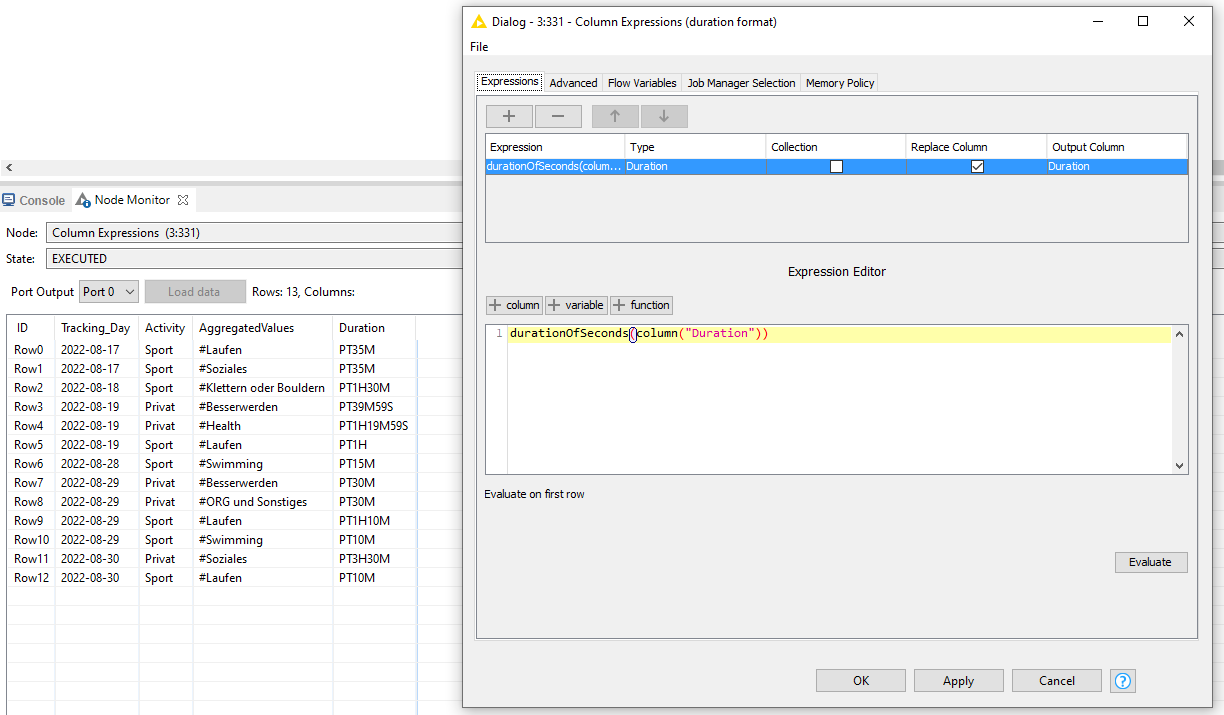
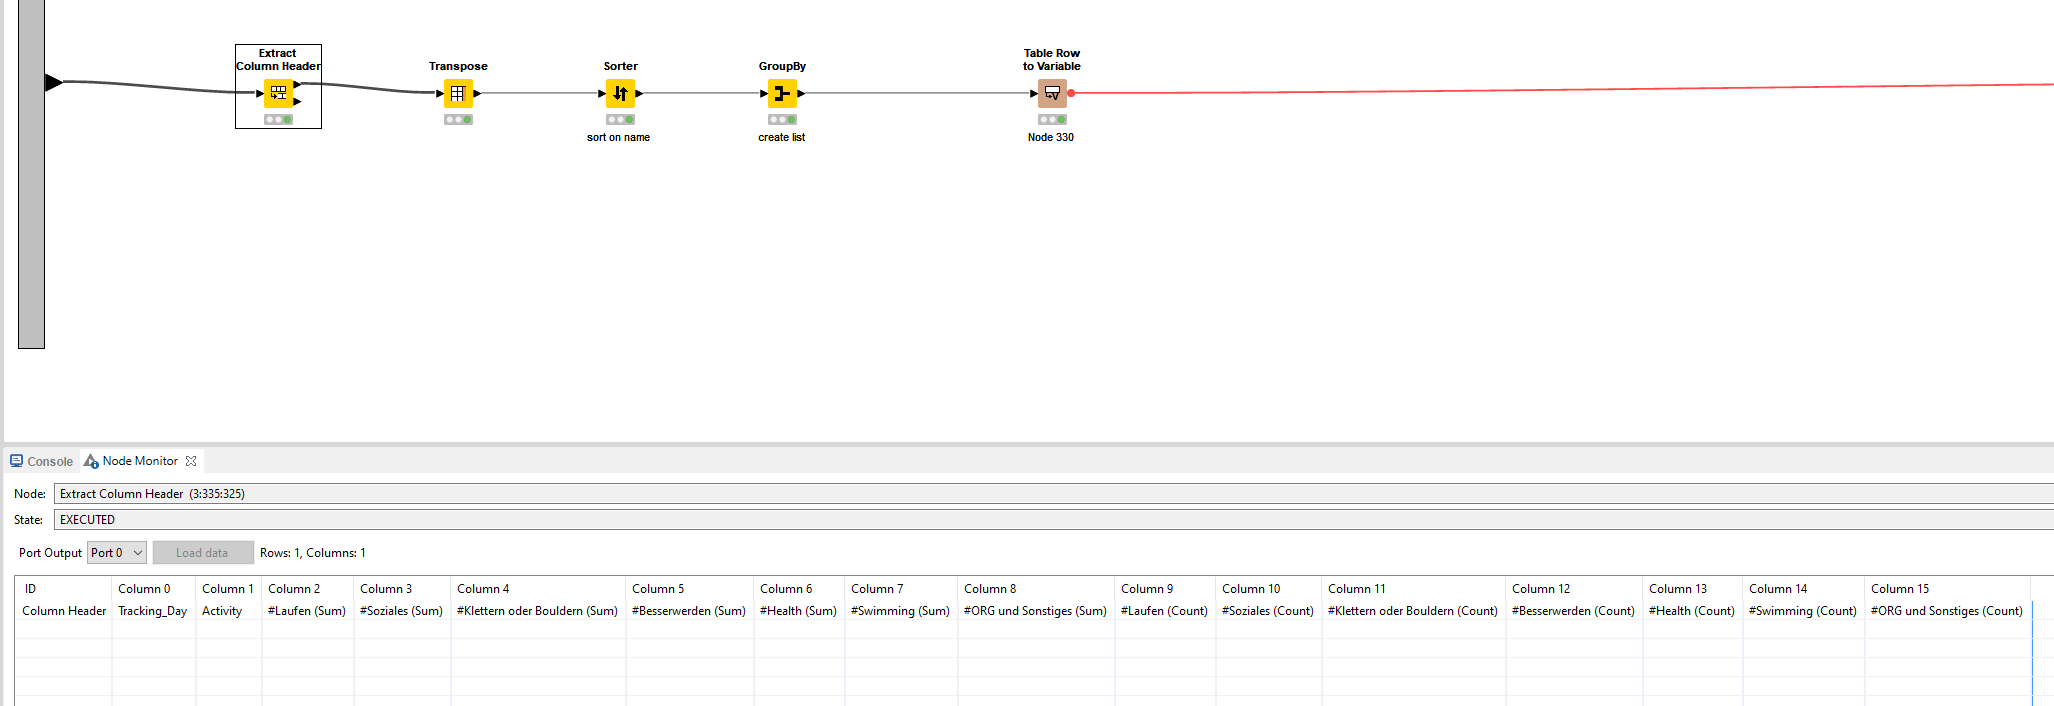
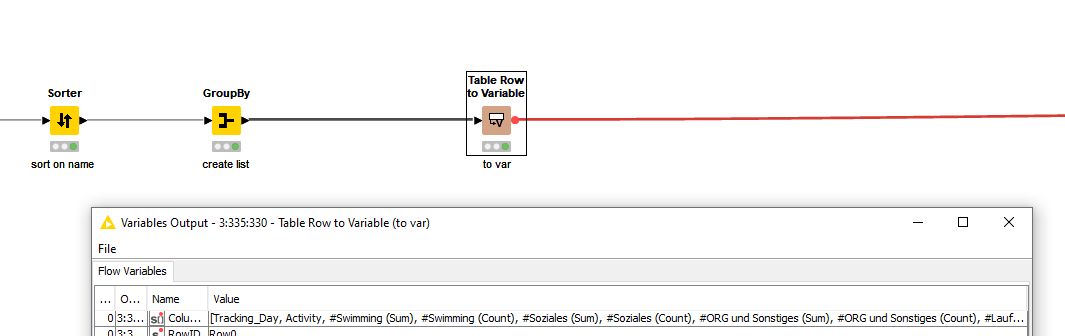
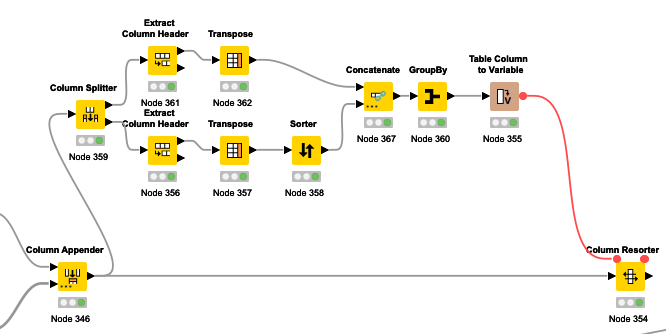
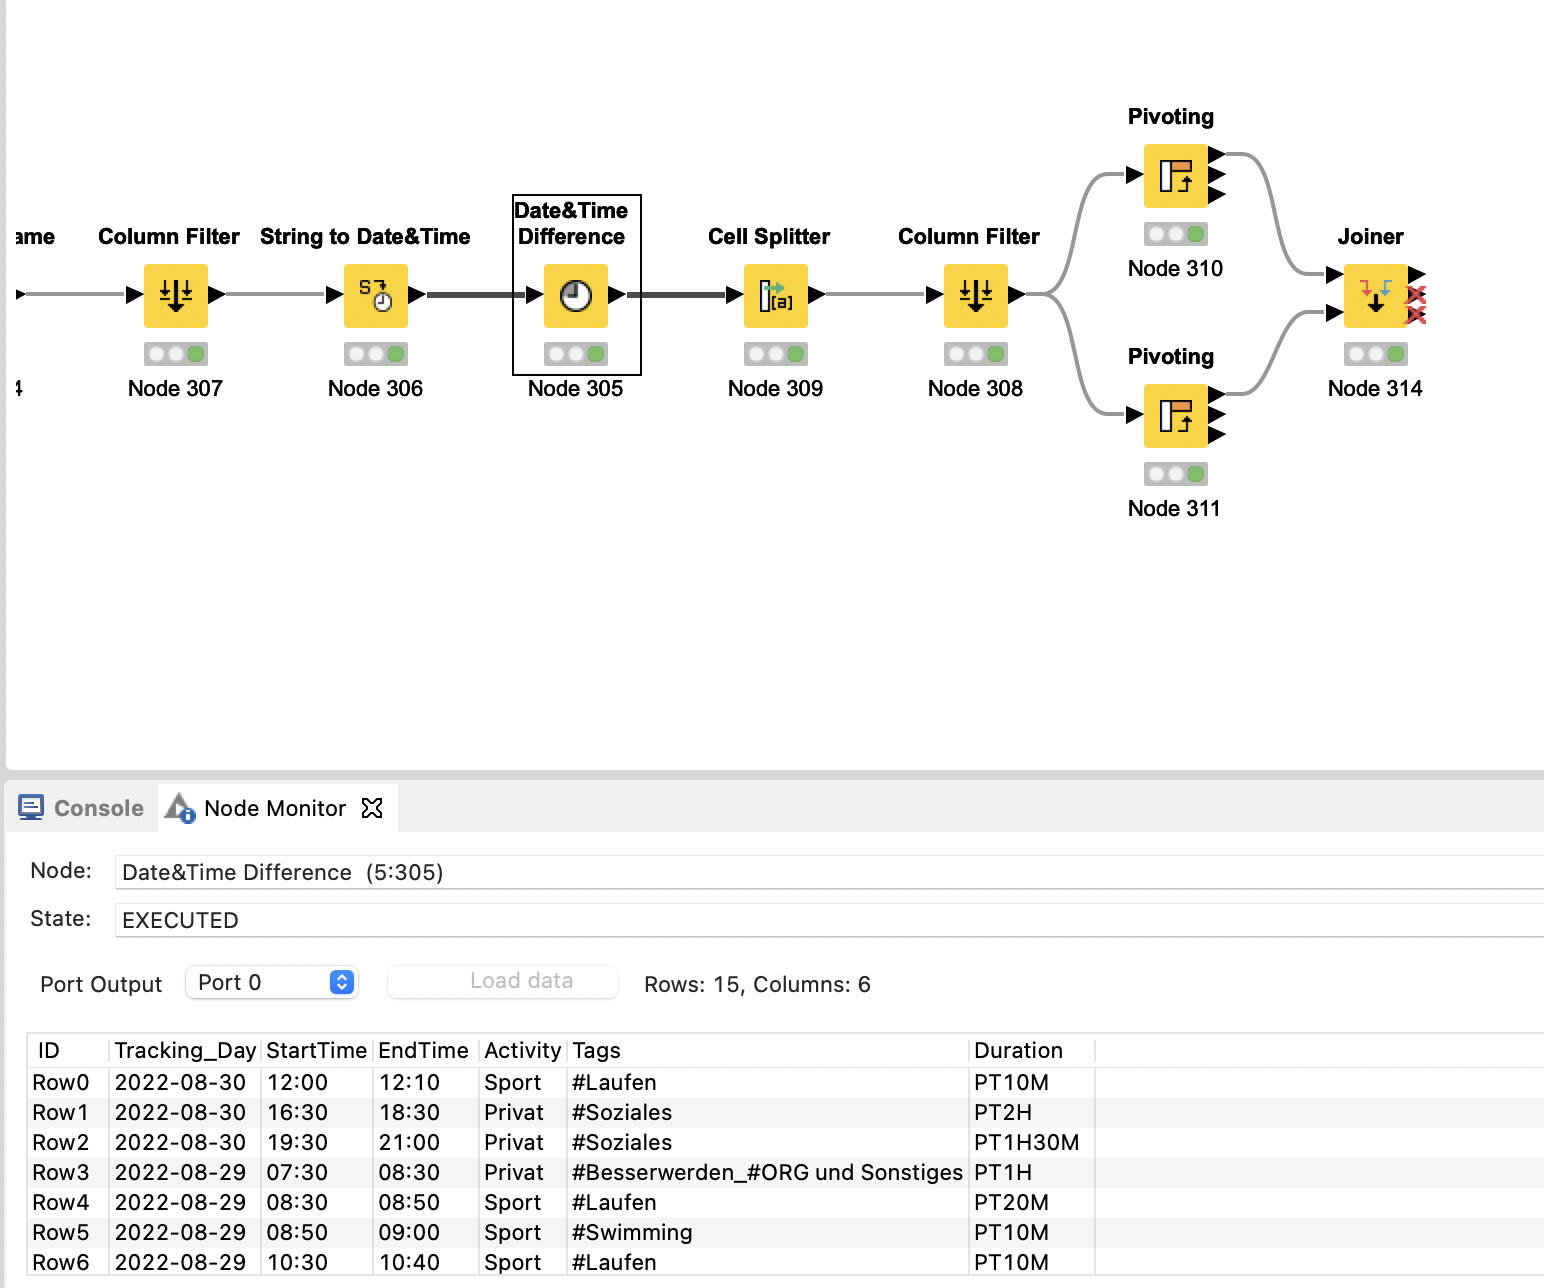
As you can see in my minimal workflow, I already tried to start with the pivot function, but I am not happy with the result so far because I do not know how to continue.
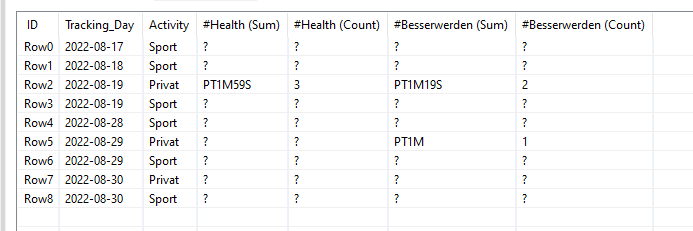
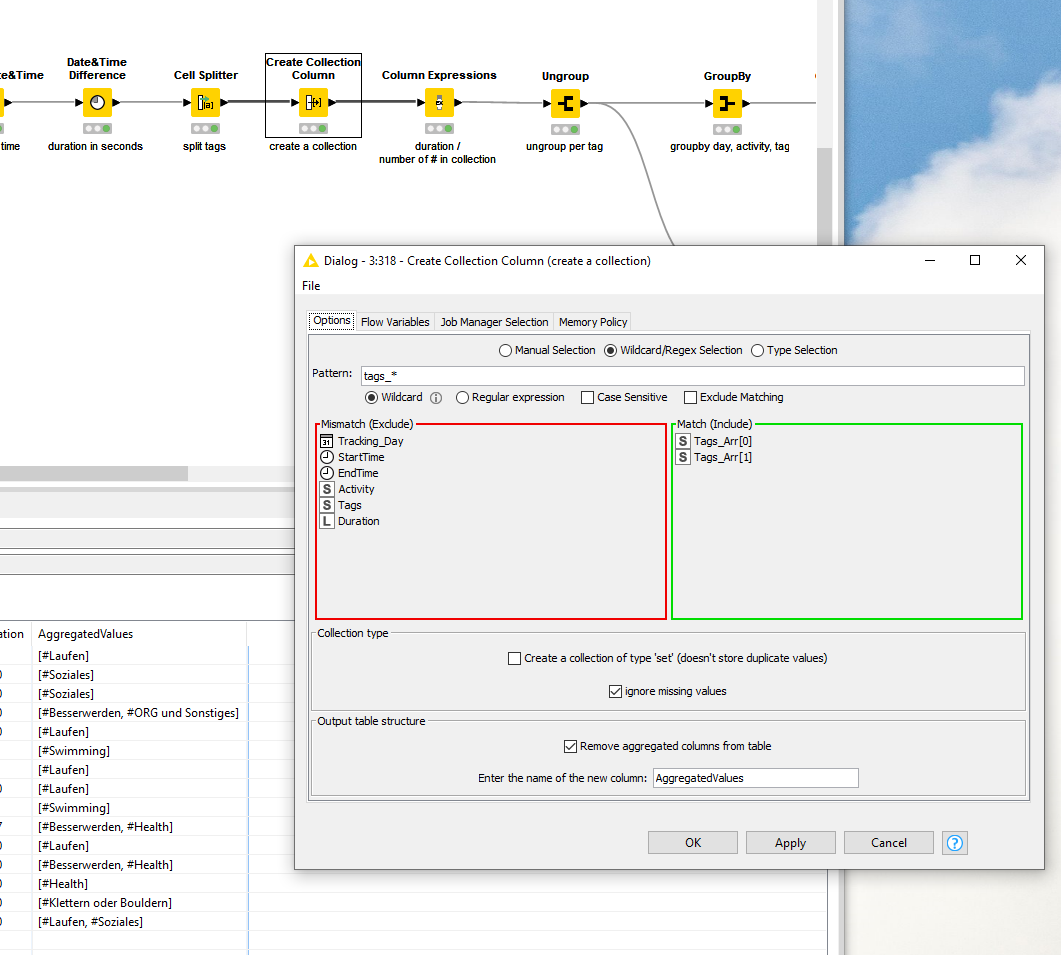
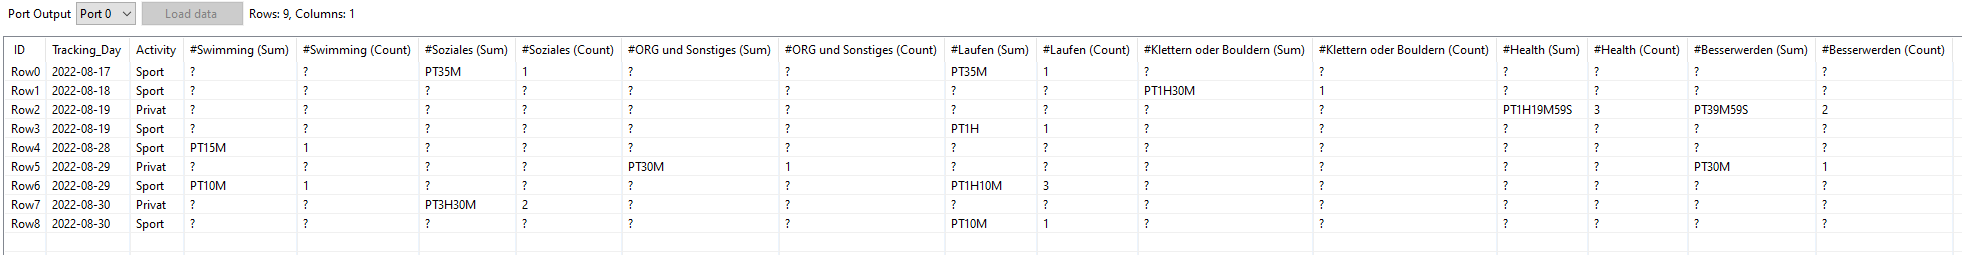
It would be great to have the time not summed up but separate in a collection or list, because I would like to later count also the elements before summing them up.
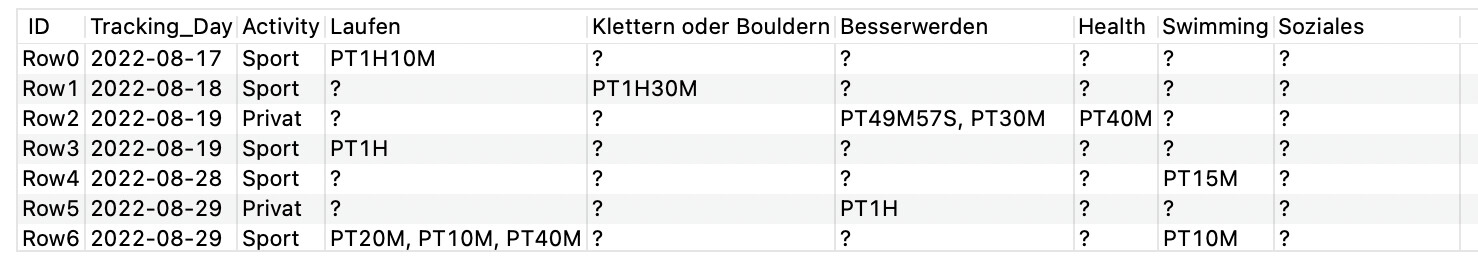
Therefore, At the final End, I would like to have a table with a ROW2 like this for Besserwerden:
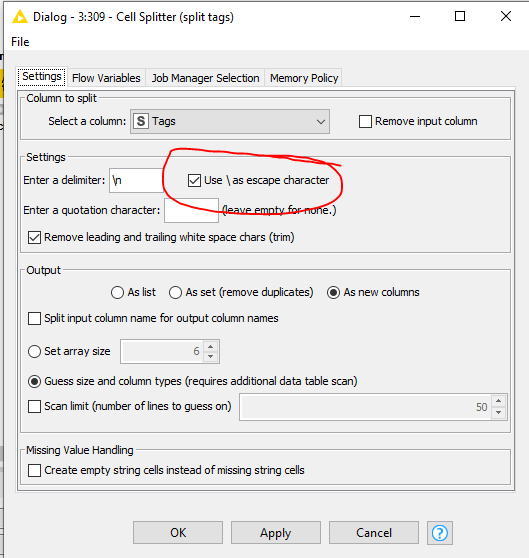
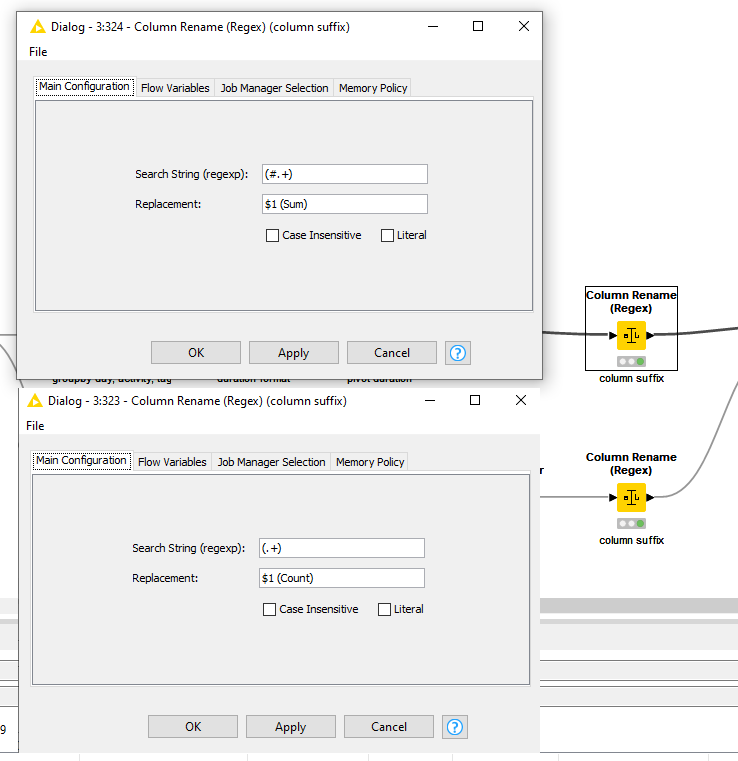
My Challenge is right now, I do not know how to transform the Tags and I do not know how to transform the lists to a count and a sum of the Duration.
I am happy about every feedback and idea to solve this challenge ![]()
Have a good evening every one.
Greetings Alex