Hello @factive
Does a solution like this apply to your requirements?
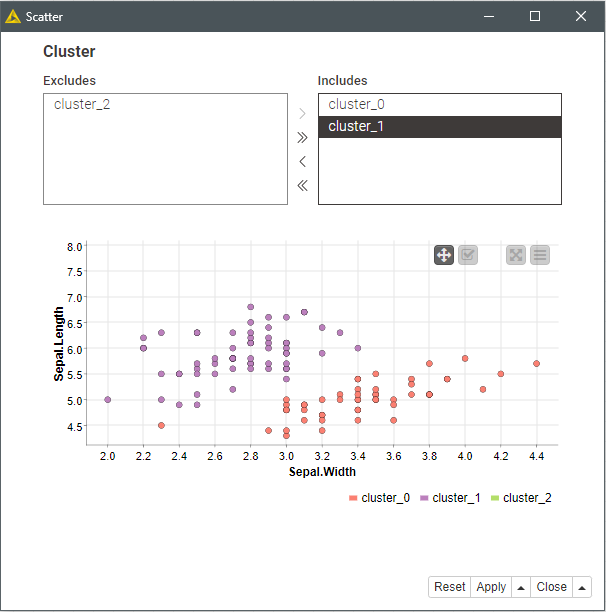
A single plot with a filter to customize the displayed clusters in the view.
20220323_plot_clusters_scatterplot.knwf (27.7 KB)
BR
PS.- This plot doesn’t have a trellis option. But you can split the clusters as suggested by @elsamuel
and group three scatter plots into a component.