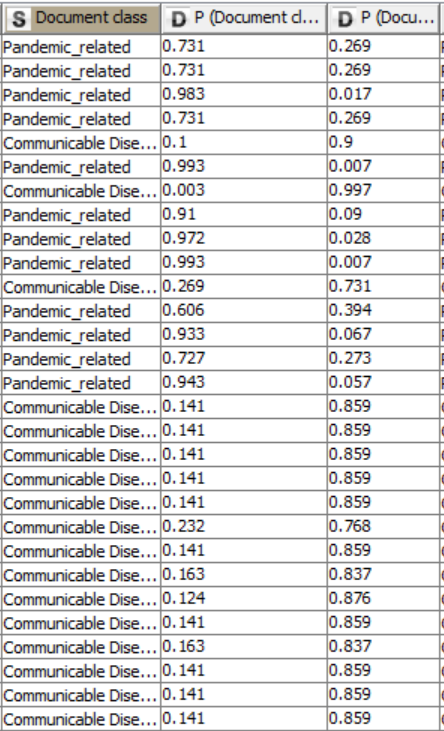
Yes, it shows prediction like 0 or 1. I attached the table and ROC results.
The other predictive models like DT and NB are shown binary like 0 or 1 but the final result on ROC is like the percentage, not 0 or 1. Do you know why?
The ROC actually only works for binary classification.
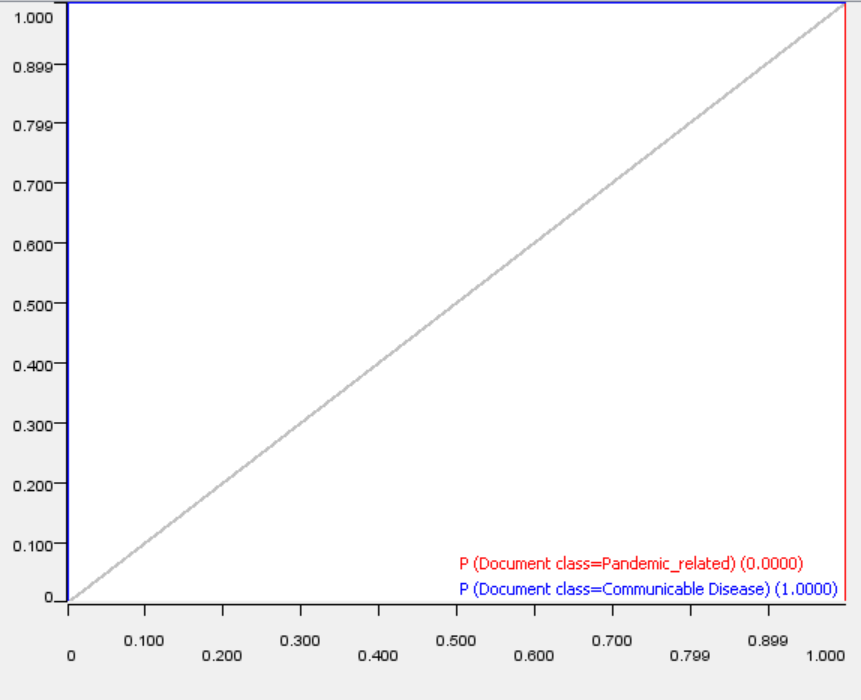
In the dialog you have to specify the column containing the ground truth (i.e. the actual classes of the rows) and the column containing the predicted probability for this class.
From your screenshot it seems like you selected both the probability for the positive and for the negative class.
Your model also seems to be a bit too good because it has a AUC of 1 which is in most cases too good to be true unless you predict the training data.
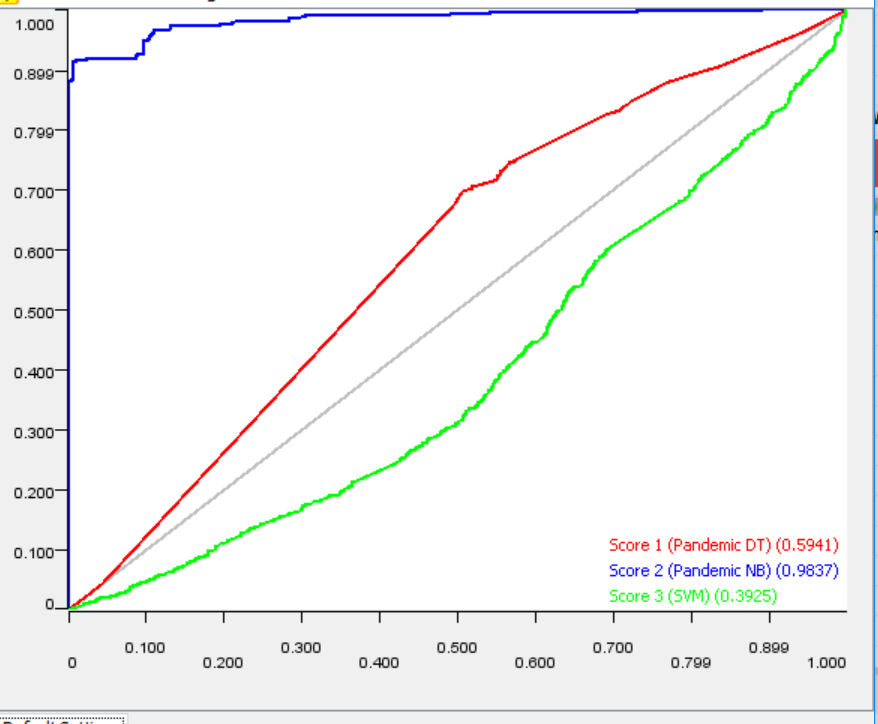
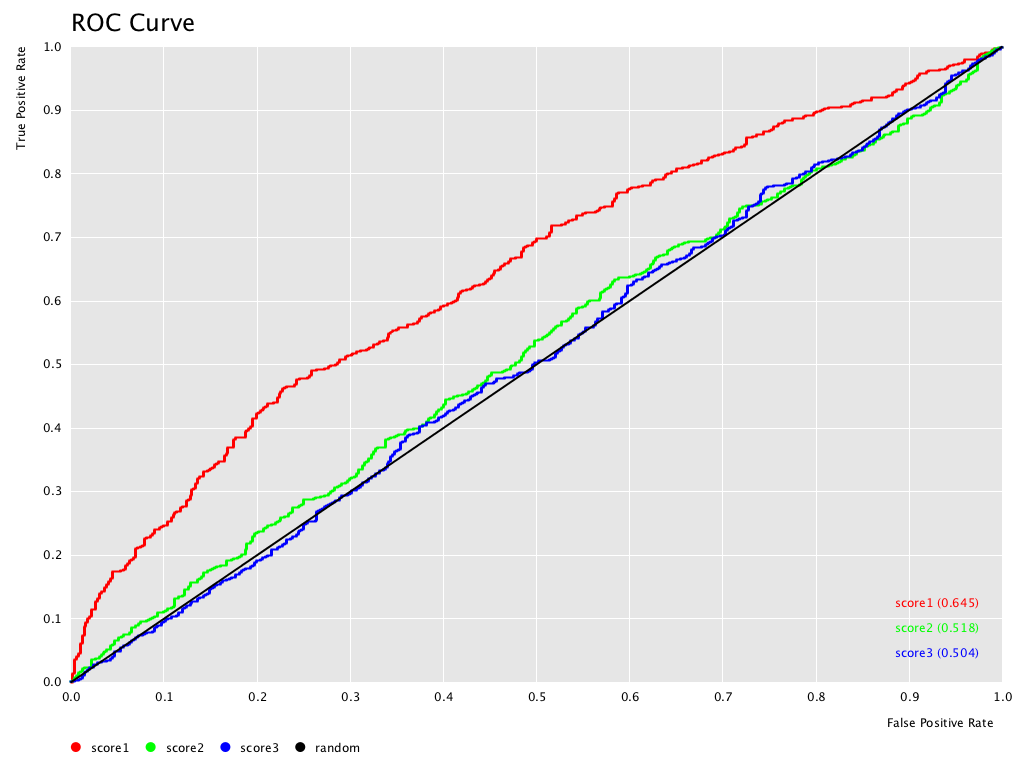
For a binary classification task, an AUC of 0.5 corresponds to a model that randomly draws one of the two classes which obviously is not desirable. If a model has an AUC below 0.5, as it is the case for your SVM, this usually implies some issue because inverting the model’s predictions would actually result in an AUC greater than 0.5 (also see this CrossValidated question).
Perhaps you accidentally use the probability for the negative class in the ROC?
In case of more than two classes, it is more difficult to draw a conclusion because the ROC still considers a binary classification problem where all classes that are not the positive class are considered to be in the negative class.

 thanks!