I have attached a sample workflow for 3 scores and a ROC curve plot in two different ways.
Maybe you could adapt that example.
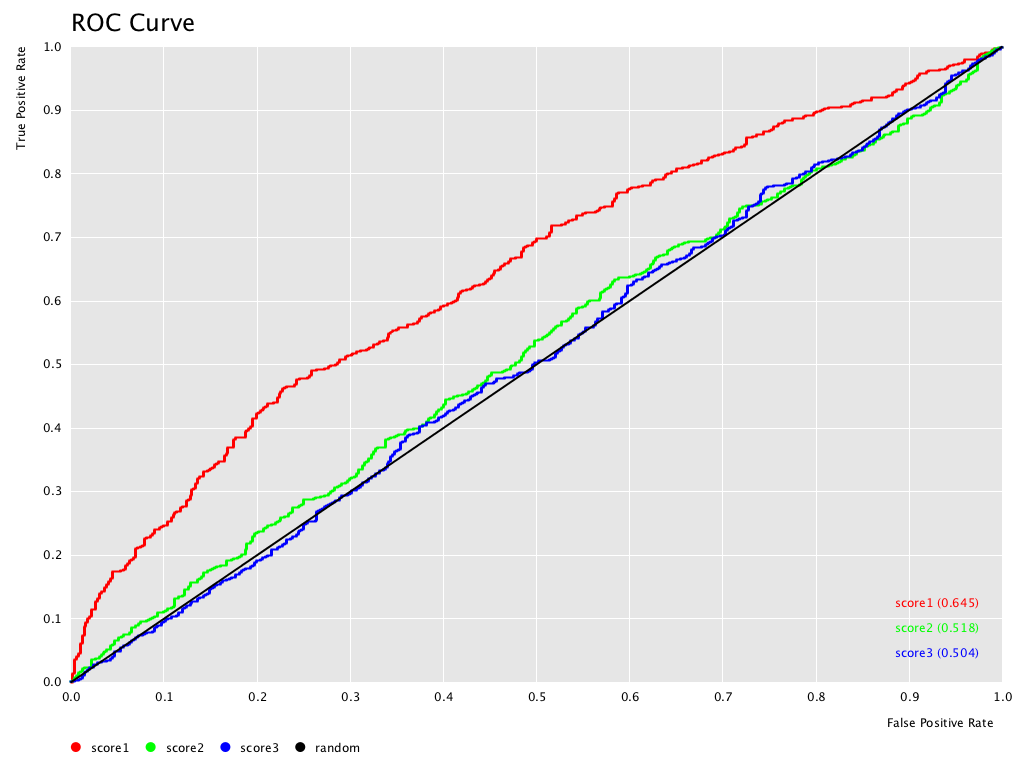

kn_example_roc3.knar (405.2 KB)
I have attached a sample workflow for 3 scores and a ROC curve plot in two different ways.
Maybe you could adapt that example.
kn_example_roc3.knar (405.2 KB)