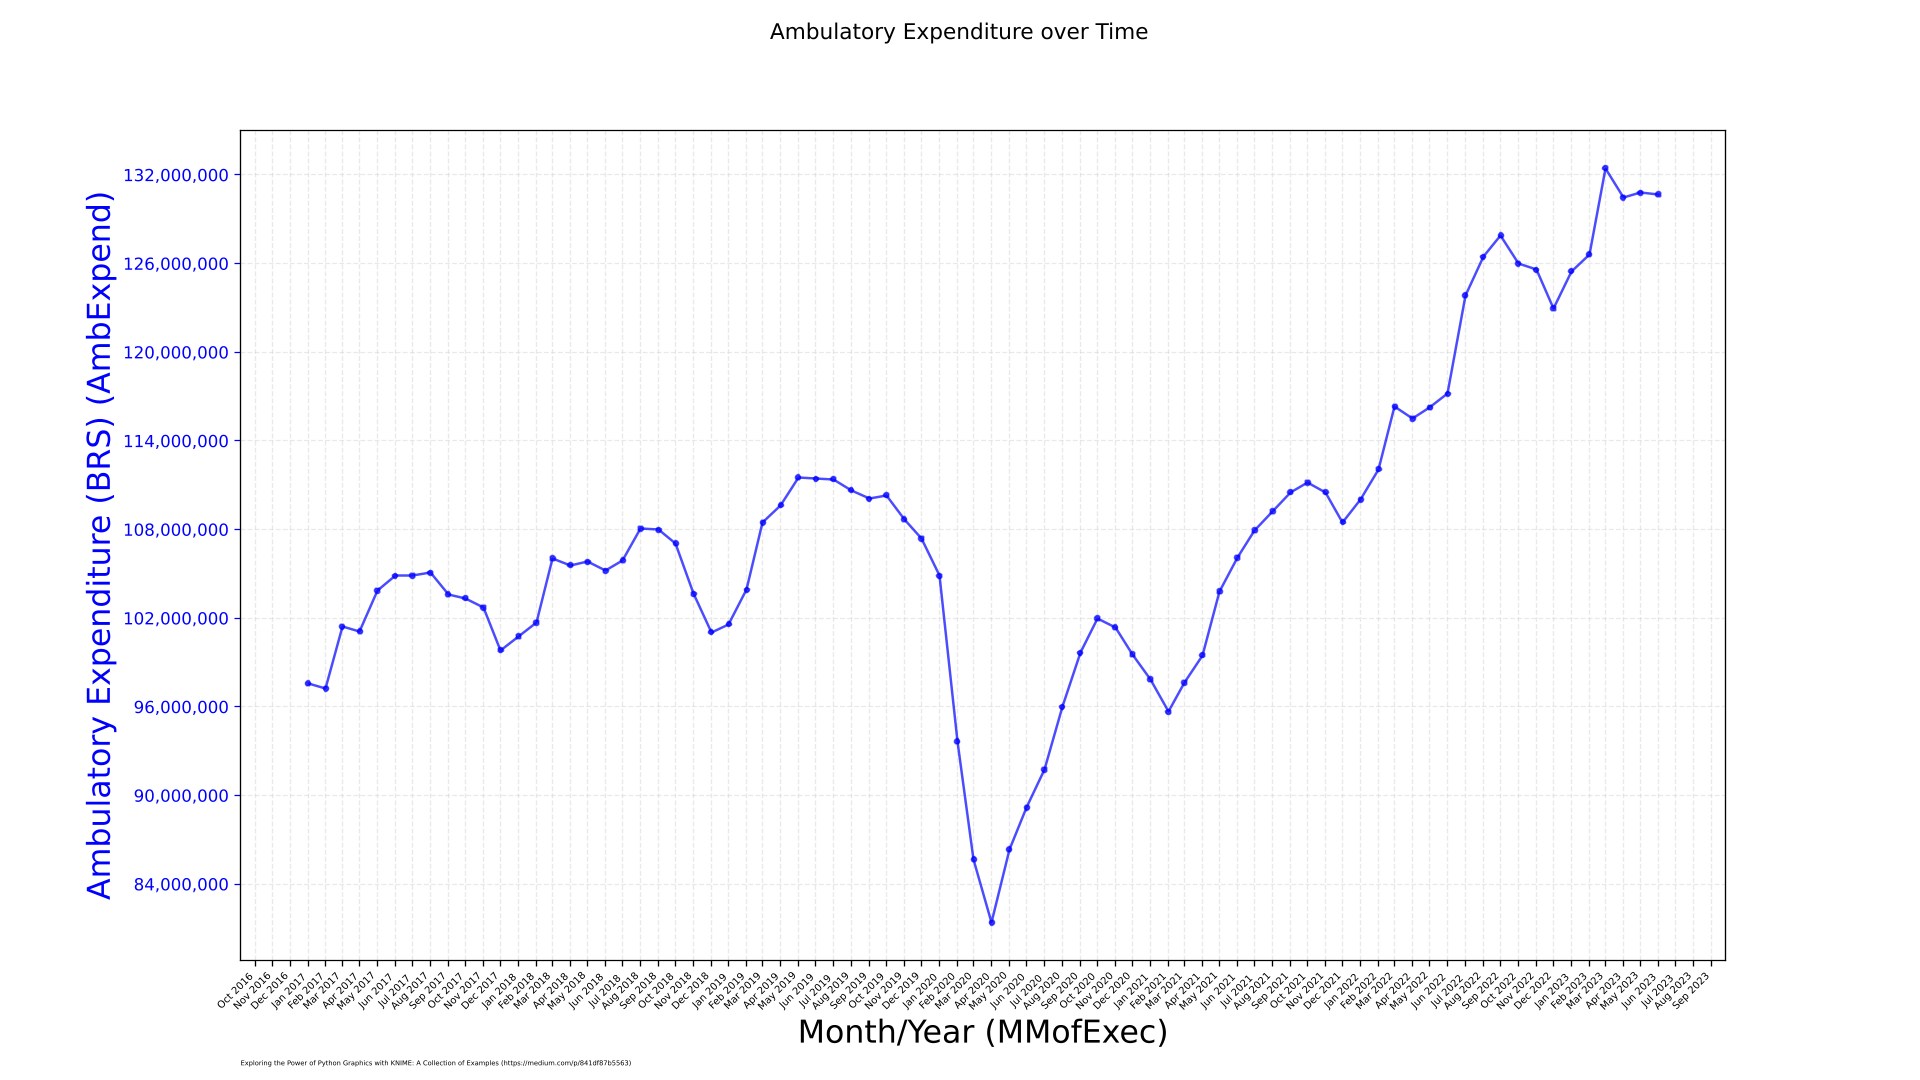
@rogerius1st and there I was hoping to convince you of the benefits of employing Python graphics in order to get interesting charts:
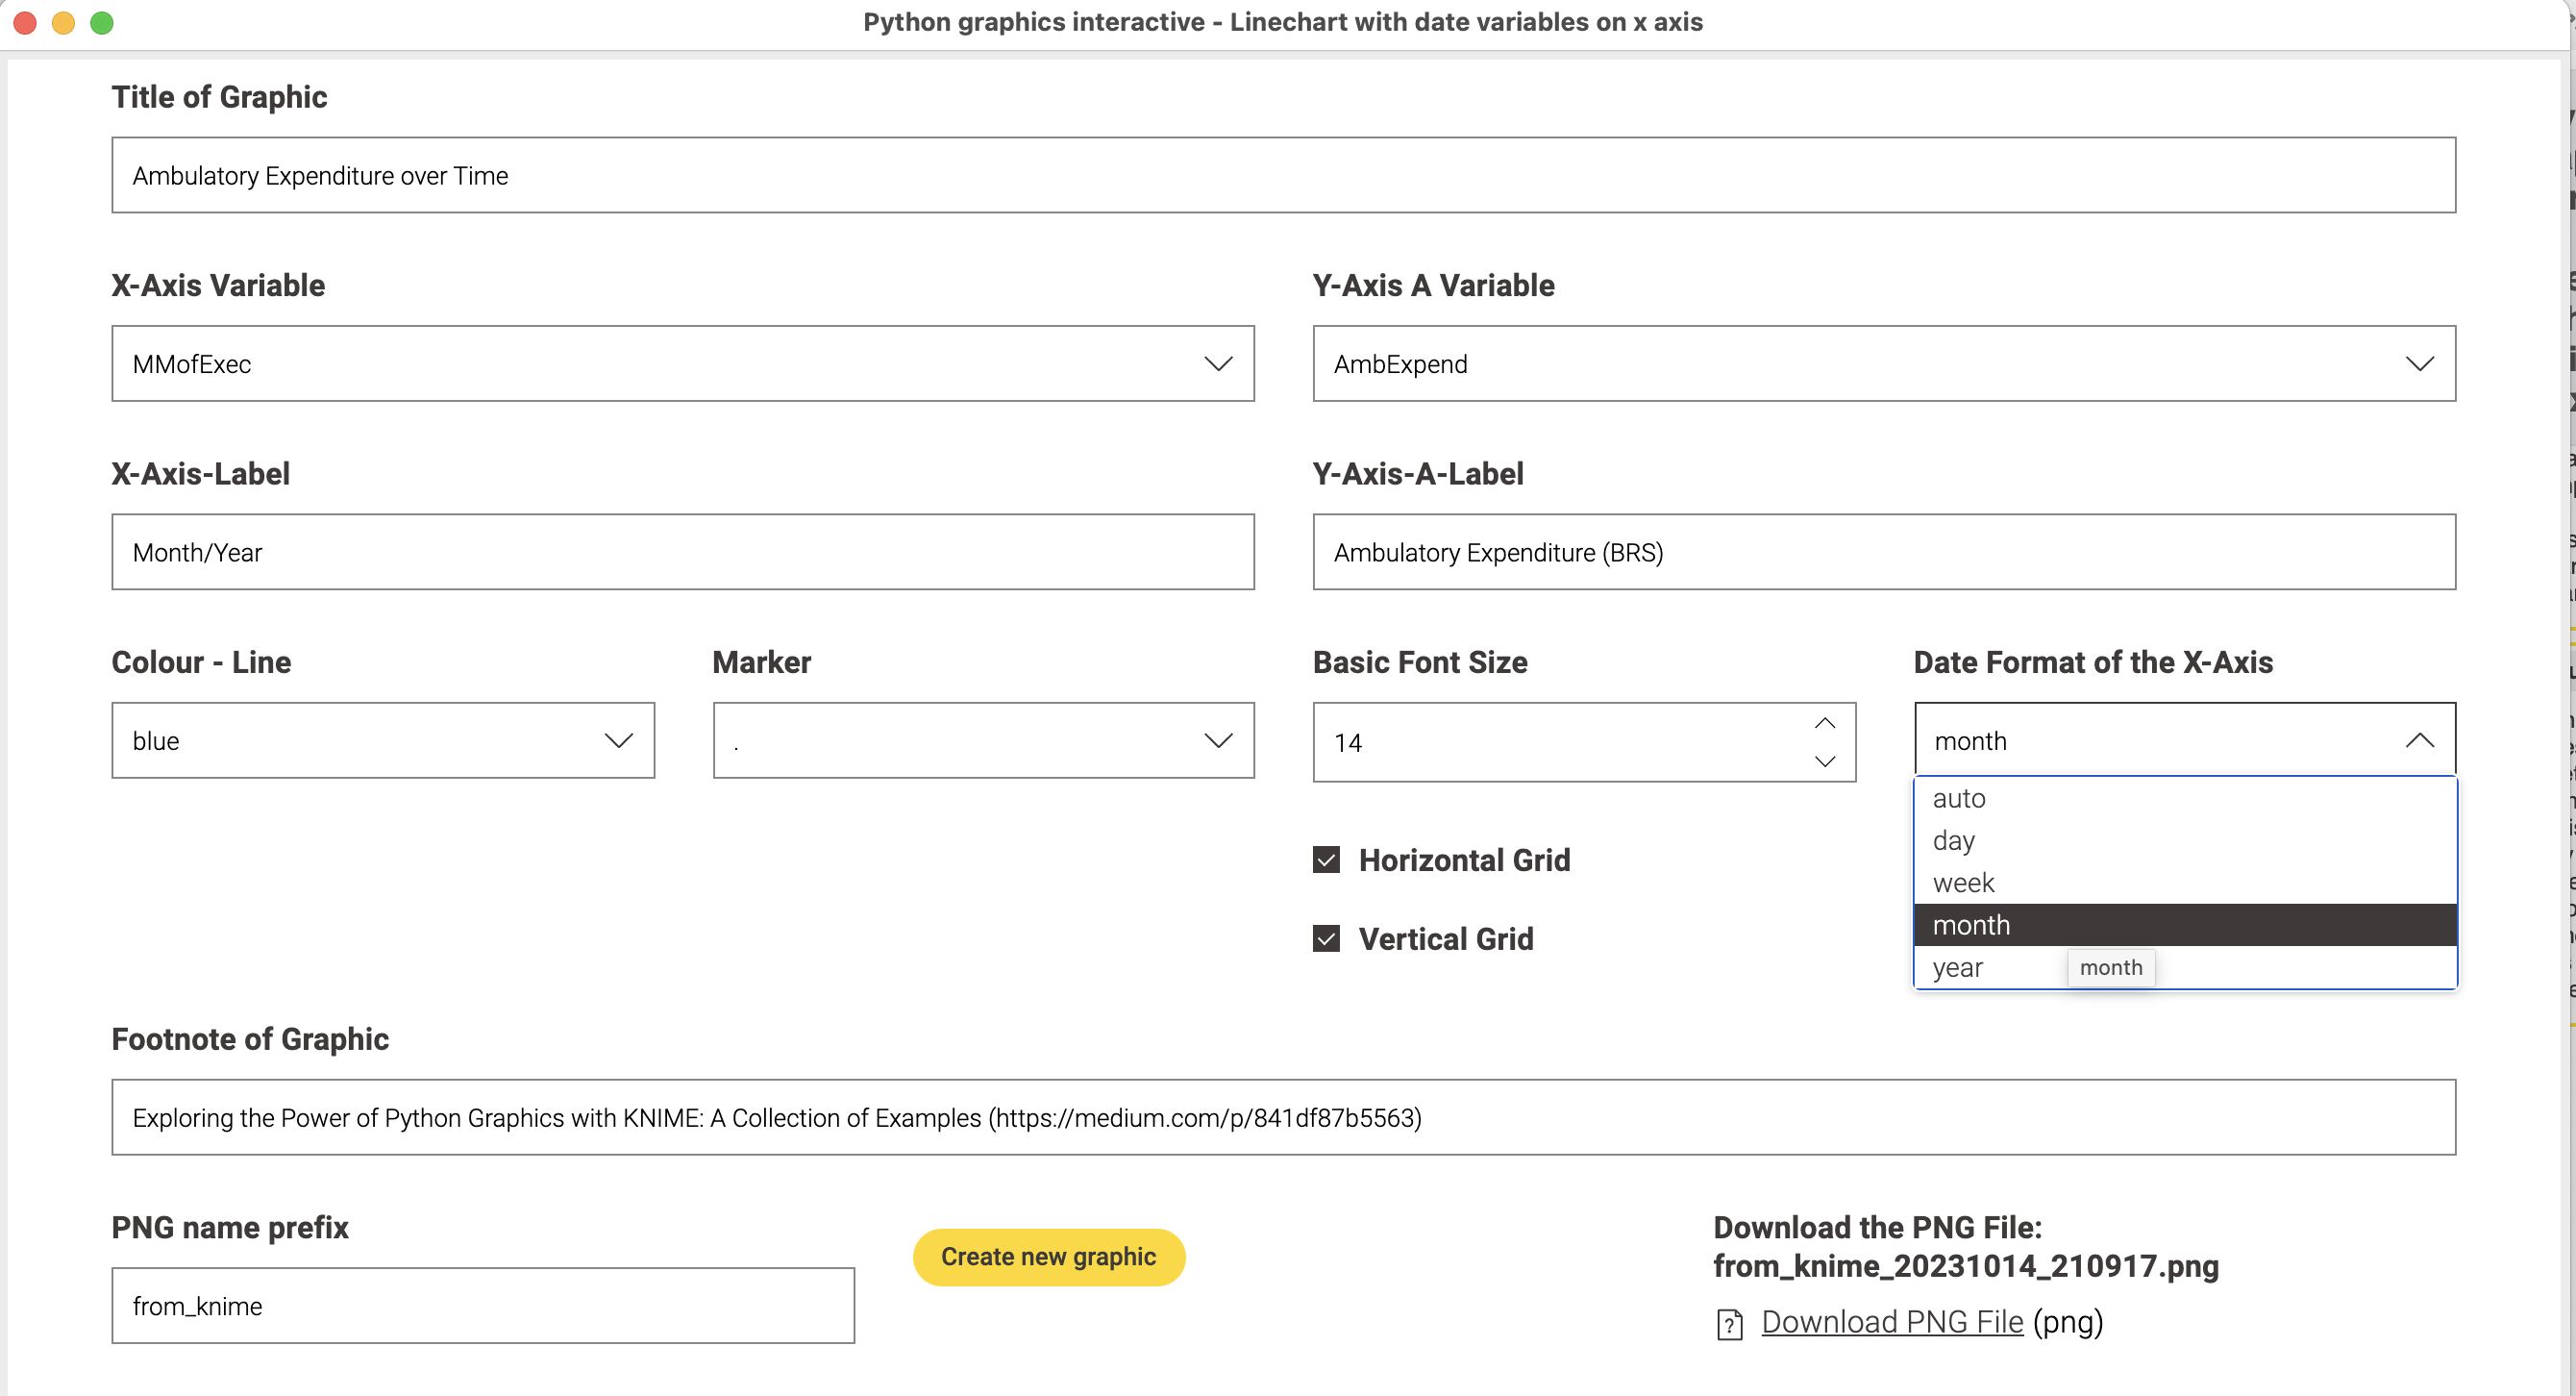
With the help of KNIME Data Apps one can create a GUI where you can select the data change settings in order to make this usable in similar situations:
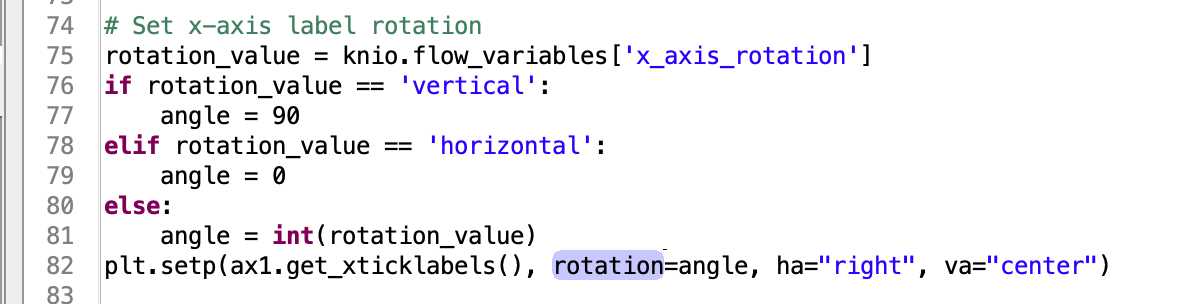
The settings will be converted into Python code. Once a framework is there you can change the settings - or even better ask ChatGPT to do it for you. Also let it explain the code. Here to steer the angle of the x-axis text:
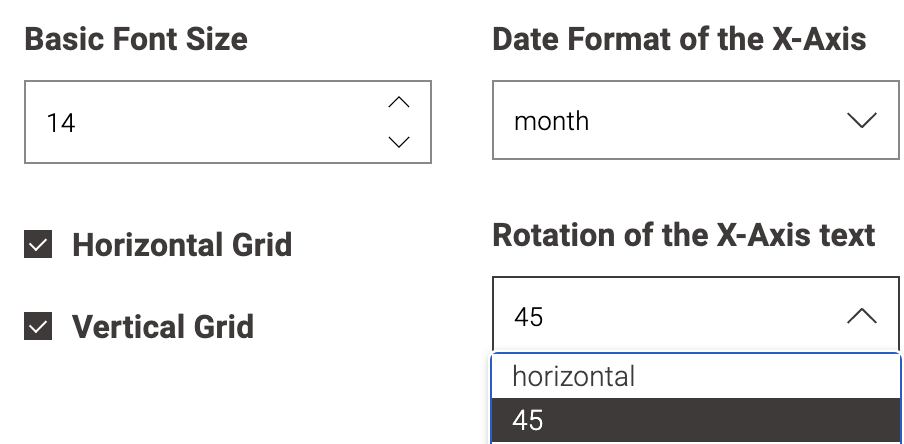
Into:
kn_example_python_graphic_linechart_date.knwf (359.1 KB)
Great as KNIME is, I think sometimes if you want more complex scientific charts with some individual settings you might want to use Python - but luckily you can integrate that into our favourite low code tool ![]()