Probably, I know the answer (‘no, it’s impossible to share interactive KNIME chart with somebody who has no KNIME installed on their machine’), however your confirmation will be more than welcome.
I would like to share KNIME interactive chart with a person having no access to KNIME and enable him to use chart interactivity. My workflow ends with ‘Color Manager’ and ‘Stacked Area Chart (JavaScript)’ nodes.
Is this possible without having KNIME installed on his machine?
I’m sure he will finally install and use KNIME, however some people need time to accept a game-changer😊
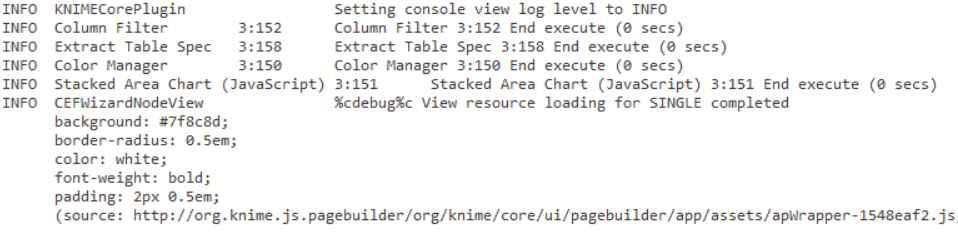
I’ve followed the steps @arofab proposed, however after changing preferences I can’t see ‘line starting with INFO JavaScriptViewCreator’ in the console:
KNIME Teams Hub is a less expensive way of sharing dashboards as well on a small scale.
You can also create an interactive dashboard in Excel using the Write to Excel Template node. If you have excel skills, then you can build an interactive dashboard tab based on array formulas that are pointed to a table in another tab which can be updated on every KNIME execution. You can even email the excel files via KNIME later in the workflow. The approach is much quicker to build out and more flexible than an interactive view, it allows the end user to make side calculations in the excel file or pull user interactions back into KNIME for further processing. You can embed the excel file into the data folder of a KNIME workbook so that it remains packaged when sending a workflow. I even use a component to either automatically or manually open it to easily present the dashboard to end users. The same approach works well for creating more complex user friendly settings controls in your workflows.
Thank you @iCFO for your suggestion. It somehow works: at the very first sight pivot table looks similar, however it loses customized colors when hiding-unhiding fields. Thus, KNIME interactivity is faaaaar better:)
Let’s have 2 solutions then: pivot chart and KNIME installation.
I always write KNIME data into a separate hidden tab and dynamically reference it to the working tabs for dashboards. This avoids any issues. I recommend using conditional formatting so that it handles changes more dynamically. I sometimes even reference over the entire table so the user can make manual adjustments in full detail and use conditional formatting to visually flag any differences from the actual live data table on the hidden tab.
Avoid doing pivot tables in excel as they do not live update to changes. Array / lookup formulas dynamically update.