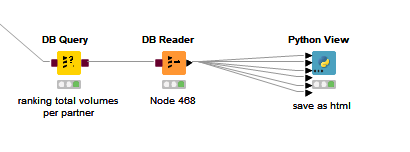
I have created three Plotly visualizations using the Python View node and saved it to a KNIME local path directory.
My objective are
-
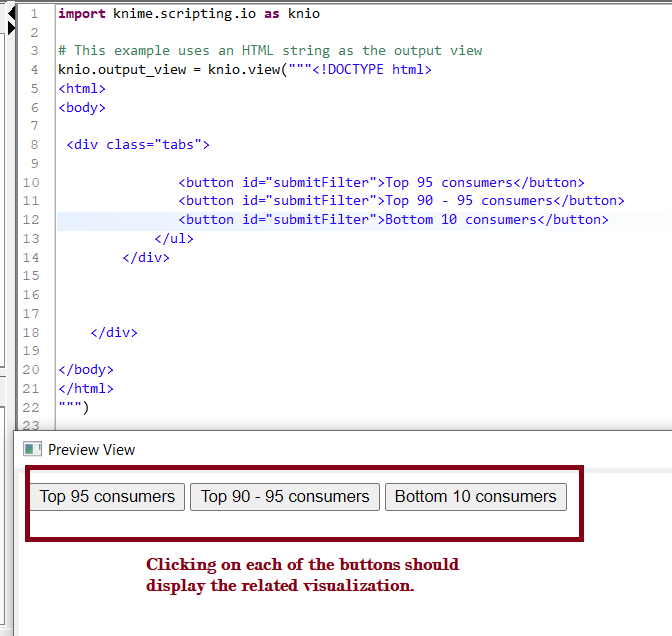
To display each saved visualization at the click of a button on a dashboard created using the composite view.
-
As an alternative to 1, construct a click event, perhaps using JavaScript, to toggle between the two visualizations instead of just displaying all three on the dashboard.
-
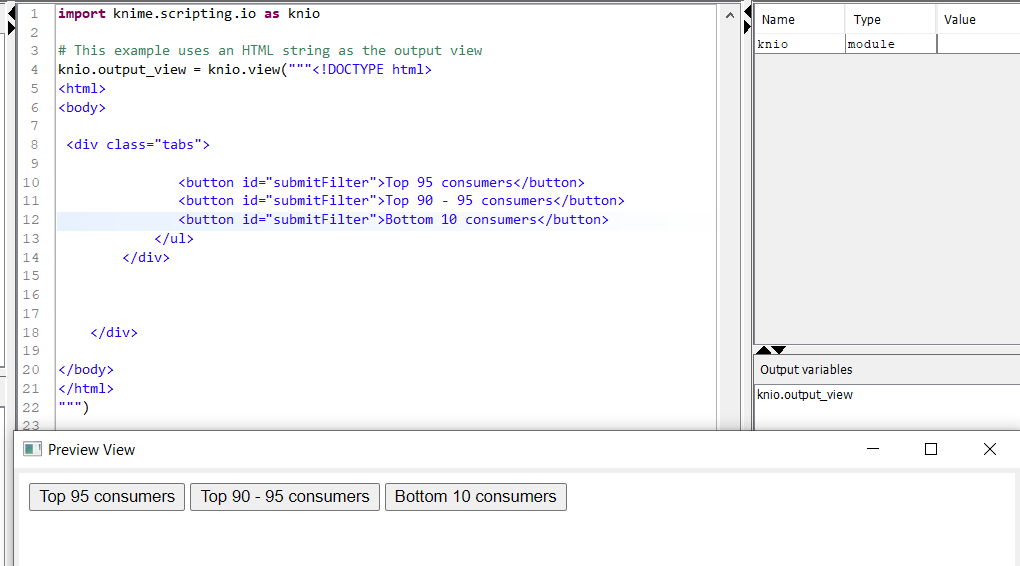
Obtaining JavaScript code that allows you to toggle between visualizations.
a.
b. HTML file saving.
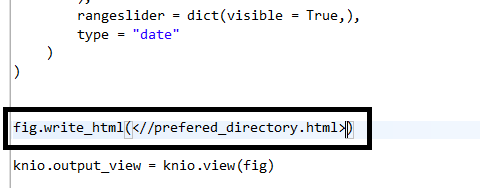
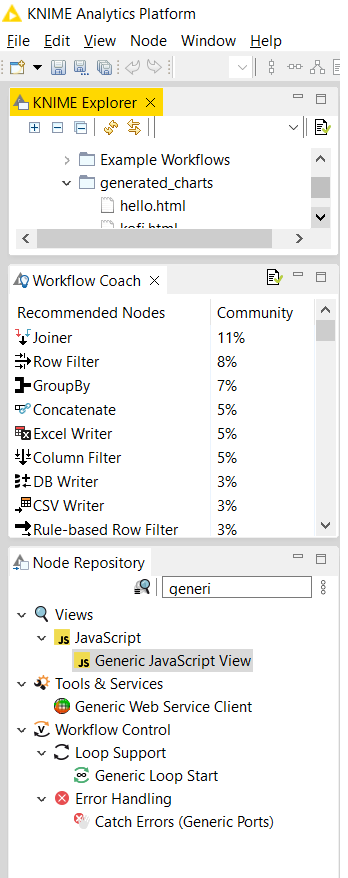
c. local file path of holding saved charts
d. An attempt at creating buttons that have should have event listeners
e. The result in mind.
Thank you in advance for all of your assistance.