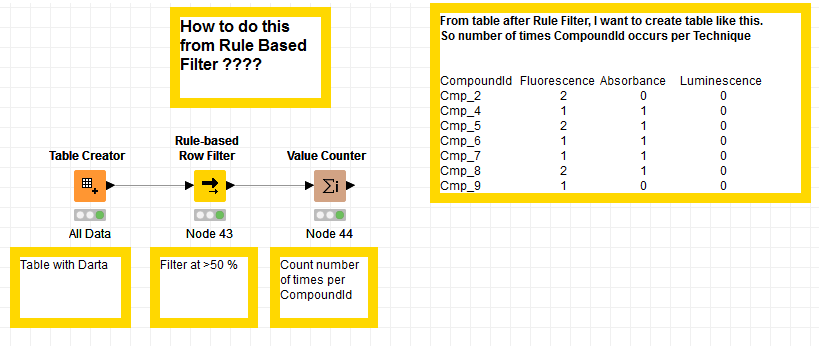
Hello, I have a table with data in 4 columns.
First I filter for data above 50% Effect, that’s fine
Secondly I count number of times a CompoundId occurs in this new list, this is also fine.
Third step is to create table with number of CompoundId’s per Technique
And this last part is the problem. I have added the table i like to create.
Does someone have an idea how to solve this.
This is the workflow sofar: Transform Techniques.knwf (10.4 KB)
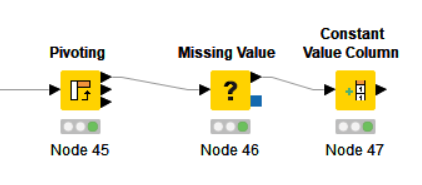
I used the nodes below after your row filter. See attached workflow. The Pivoting node can be a little tricky if you haven’t used it before, but it’s quite useful for cases like this.
I think, Pivoting node will do the job. You’ll have to feed it with the outputs from the filter that you have and set it up to use CoumpundId in Groups (i.e. rows of the output table), Technique in Pivots (i.e. columns of the output table) and Experiment Count in the Manual Aggregation. You might need to apply some manipulations afterwards: e.g. fill missing values with zeros and add columns for the Technique types, that do not appear in the data, if any (e.g. the minimal test dataset did not contain Luminescence among Technique)