Hello.
Thank you always.
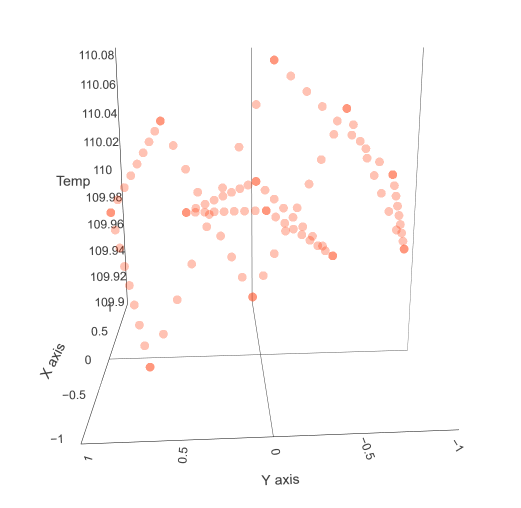
There is coordinate data as shown in the attached picture.
I would like to get a plot using the Contour Plot Node or Surface Plot Node.
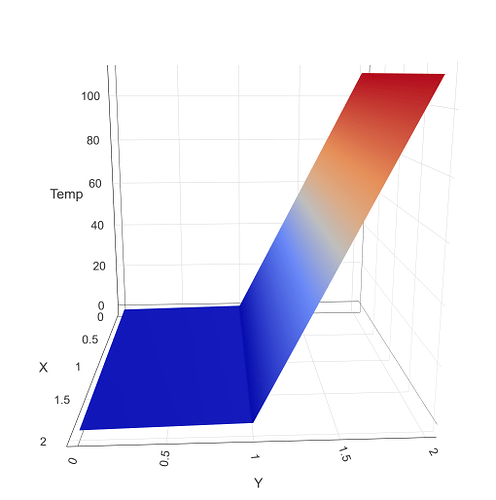
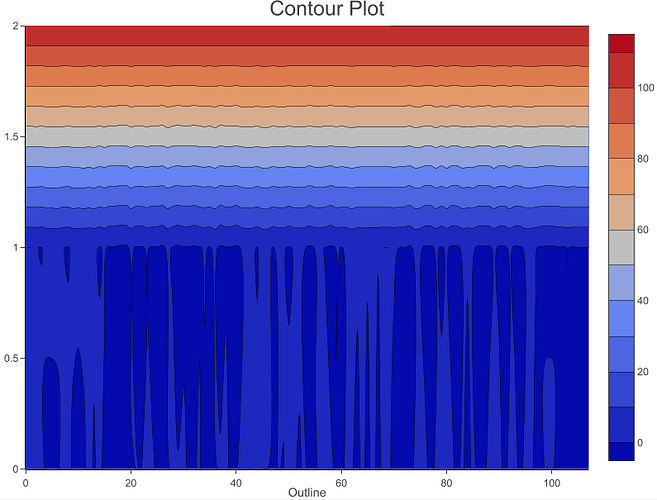
However, when I put my data in, the next picture will be Plot.
Where did the problem come from?
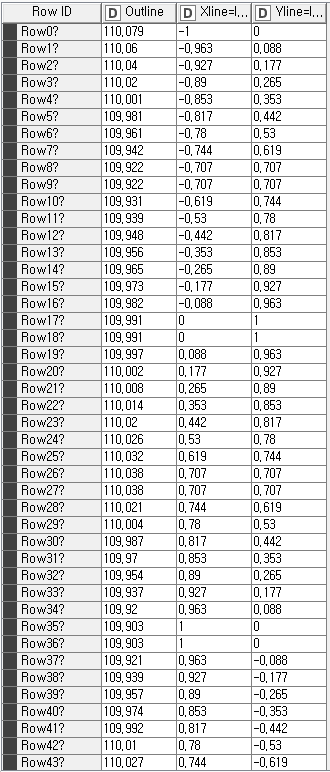
My data is in the following format.
Thank you.


