Hello everyone, I have a question about how I can use KNIME software to use D3.JS to visualize the data I am processing. Give a simple example:
For example, how to use the chord diagram in d3. js. I have some understanding of data processing. Overall, it involves processing data into JSON format and replacing it with D3.js.
But how to achieve results in KNIME software has never been successful. Request your help.
Thank you.
D3.JS :
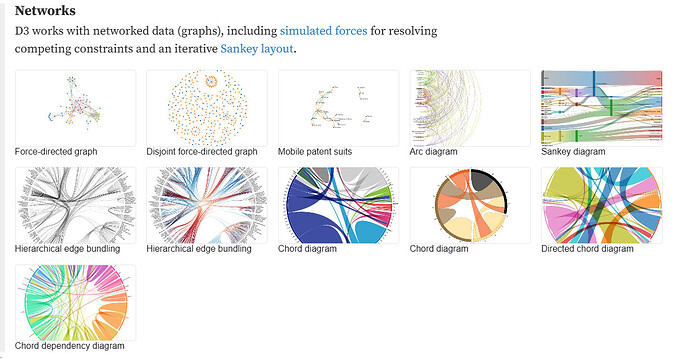
D3 Gallery / D3 | Observable (observablehq.com)
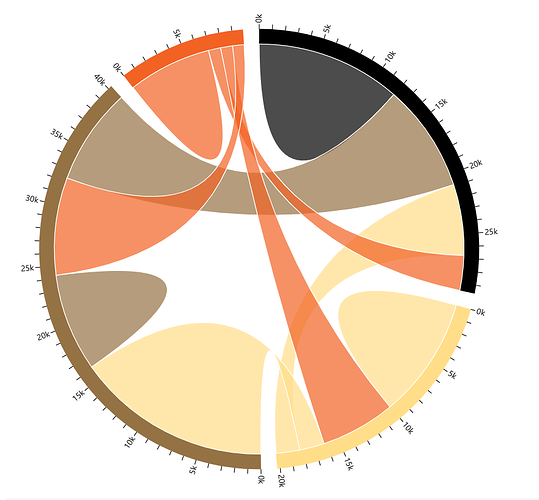
Chord diagram / D3 | Observable (observablehq.com)
chart = {
const width = 640;
const height = width;
const outerRadius = Math.min(width, height) * 0.5 - 30;
const innerRadius = outerRadius - 20;
const {names, colors} = data;
const sum = d3.sum(data.flat());
const tickStep = d3.tickStep(0, sum, 100);
const tickStepMajor = d3.tickStep(0, sum, 20);
const formatValue = d3.formatPrefix(“,.0”, tickStep);
const chord = d3.chord()
.padAngle(20 / innerRadius)
.sortSubgroups(d3.descending);
const arc = d3.arc()
.innerRadius(innerRadius)
.outerRadius(outerRadius);
const ribbon = d3.ribbon()
.radius(innerRadius);
const svg = d3.create(“svg”)
.attr(“width”, width)
.attr(“height”, height)
.attr(“viewBox”, [-width / 2, -height / 2, width, height])
.attr(“style”, “max-width: 100%; height: auto; font: 10px sans-serif;”);
const chords = chord(data);
const group = svg.append(“g”)
.selectAll()
.data(chords.groups)
.join(“g”);
group.append(“path”)
.attr(“fill”, d => colors[d.index])
.attr(“d”, arc)
.append(“title”)
.text(d => ${d.value.toLocaleString("en-US")} ${names[d.index]});
const groupTick = group.append(“g”)
.selectAll()
.data(d => groupTicks(d, tickStep))
.join(“g”)
.attr(“transform”, d => rotate(${d.angle * 180 / Math.PI - 90}) translate(${outerRadius},0));
groupTick.append(“line”)
.attr(“stroke”, “currentColor”)
.attr(“x2”, 6);
groupTick
.filter(d => d.value % tickStepMajor === 0)
.append(“text”)
.attr(“x”, 8)
.attr(“dy”, “.35em”)
.attr(“transform”, d => d.angle > Math.PI ? “rotate(180) translate(-16)” : null)
.attr(“text-anchor”, d => d.angle > Math.PI ? “end” : null)
.text(d => formatValue(d.value));
svg.append(“g”)
.attr(“fill-opacity”, 0.7)
.selectAll()
.data(chords)
.join(“path”)
.attr(“d”, ribbon)
.attr(“fill”, d => colors[d.target.index])
.attr(“stroke”, “white”)
.append(“title”)
.text(d => ${d.source.value.toLocaleString("en-US")} ${names[d.source.index]} → ${names[d.target.index]}${d.source.index !== d.target.index ? \n${d.target.value.toLocaleString(“en-US”)} ${names[d.target.index]} → ${names[d.source.index]} : ``});
return svg.node();
}
groupTicks = ƒ(d, step)
function groupTicks(d, step) {
const k = (d.endAngle - d.startAngle) / d.value;
return d3.range(0, d.value, step).map(value => {
return {value: value, angle: value * k + d.startAngle};
});
}
0: Array(4) [11975, 5871, 8916, 2868]
1: Array(4) [1951, 10048, 2060, 6171]
2: Array(4) [8010, 16145, 8090, 8045]
3: Array(4) [1013, 990, 940, 6907]
names: Array(4) [“black”, “blond”, “brown”, “red”]
colors: Array(4) [“#000000”, “#ffdd89”, “#957244”, “#f26223”]
data = Object.assign([
[11975, 5871, 8916, 2868],
[ 1951, 10048, 2060, 6171],
[ 8010, 16145, 8090, 8045],
[ 1013, 990, 940, 6907]
], {
names: [“black”, “blond”, “brown”, “red”],
colors: [“#000000”, “#ffdd89”, “#957244”, “#f26223”]
})
I hope some friends can help me, thank you very much.

