How to visualize counts of specific values in multiple columns

I have a number of rows that I ran through a number of rules, with each rule creating its own column and recording the rules outcome. I now need to do something to arrive at a count of specific values per each column and show it in the pie chart. Let me demonstrate what I have and what I want to achieve:

Table:

Account Number | Rule 1 | Rule 2 | Rule 3
111 Compliant Compliant Error A
222 Error B Compliant Compliant
333 Compliant Error C Error A
444 Error B Error C Error A

What I want to get in the end is the count of Errors in each colum (I used ‘Compliant’ only to not have empty field, but I can do it if needed, I am no interested in this value)
Error B -2
Error C -2
Error A -3

I need these counts so that I can now represent it in a simple pie chart.

What are you suggestions? Thank you for helping me out with this debuckle.
Hi,
I assumed that:

  • Each rule column may contain any error value (A, B, C) although each rule column in your example has a specific error value.
  • Rule columns may contain all the available values (including errors and the “Compliant” value) or just all the available errors.
  • There may be the same error in two (or more) rule columns (in a single row).

(Maybe my assumptions are unnecessary but I prefered to consider them all)

And here is the solution:

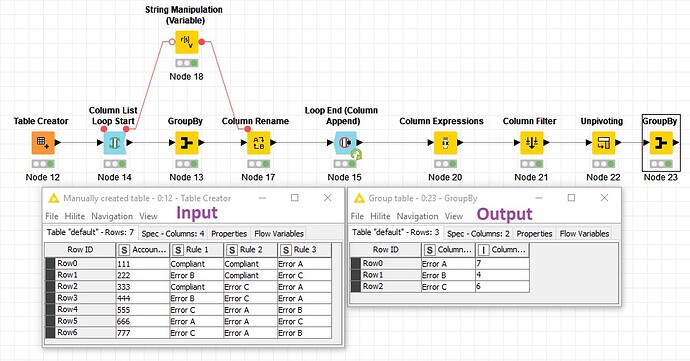
In this workflow, I looped over the rule columns and counted the number of unique values. Then by using a “Column Expressions” node, I calculated the sum of each error’s count in all rule columns. Finally I used an “Unpivoting” and a “GroupBy” node to create the desired output format.

Please check the workflow and let me know if it’s what you need:
rule-error.knwf (43.6 KB)

Best,
Armin

1 Like

Armin, Thank you, thank you, thank you!!!

I would never know how to set it up myself. Thank you for taking time and helping me out!

2 Likes