There is an R package that seems to be helping with that. ‘modes’
https://cran.r-project.org/web/packages/modes/modes.pdf
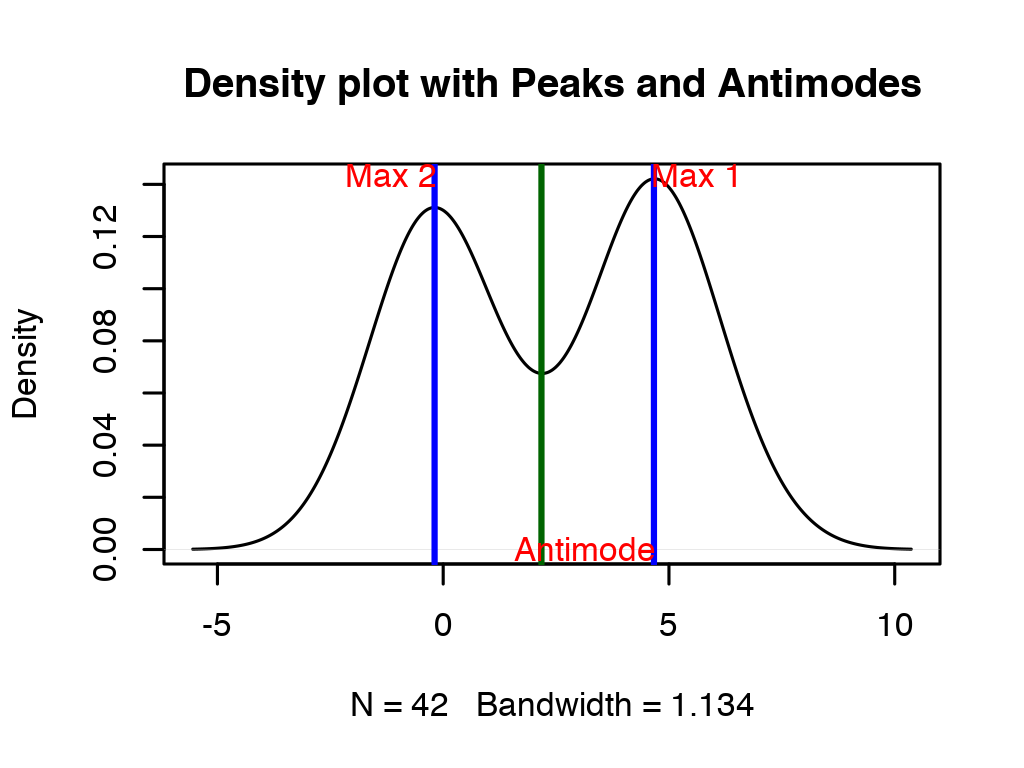
You could use that in KNIME and see if you can use the statistics that are provided by this package to make a decision. It also creates a plot where you can visually inspect if there is a Bi-Modal distribution. You might adapt that to test for further distributions.
Please note I am not an expert in these statistics, just built them into a workflow ![]() . The description for the package for example states that for the:
. The description for the package for example states that for the:
bimodality_coefficient - "The bimodality coefficient has a range of zero to one (that is: [0,1]) where a value greater than “5/9” suggests bimodality. "
So with 0.774 being larger than 0.556 the statistic here would indicate that the distribution is bimodal. And the visual inspection seems to support that.
I was toying around with creating a variable to bring the description into the graphic but gave up for now. You might include that ins some future graphic you might create.

kn_example_r_bimodality.knar (325.7 KB)
Edit - A new version for KNIME 5 R Graphics - use R package modes to detect bimodality, calculate coefficients and create a chart – KNIME Community Hub