I need an advice. For the file like:
Specialty1, Provider1, Code1, Code_Frequency
Specialty1, Provider1, Code2, Code_Frequency
Specialty1, Provider1, Code3, Code_Frequency
…
Specialty1, Provider2, Code1, Code_Frequency
…
I’m looking for outliers who used too many Codes or too little codes for specified Specialty. Number of codes could be 100 per specialty and about 400 providers
I used DBScan for some close task but just 10 codes.
It would be nice to see an example with data preparation as some methods require
specific input format.
Also, I need a solution using just KNIME nodes (no R, Pyton)
Maybe I’m oversimplifying your use case, but the first thing that came to mind was the Numeric Outliers node. It would allow you to group by specialty inherently. I know it’s a straight statistical approach as opposed to unsupervised clustering, but maybe it’s worth considering?
You can see it used in this workflow, along with DBSCAN and a couple of other methods.
Now I experiment with Numeric outliers node and got question if I do it correct and how to get some statistics.
Firs, I transformed input file like
Specialty Provider Code1, Code2, … CodeN
Specialty1, Provider1, Frequency1, Frequency2… FrequencyN
Specialty1, Provider2, Frequency1, Frequency2… FrequencyN
Specialty1, Provider3, Frequency1, Frequency2… FrequencyN
…
Specialty2, Provider4, Frequency1, Frequency2… FrequencyN
…
I need to get a list for every specialty combination of provider with codes they use as outliers.
On configuration I use Specialty as a group and checked for Compute statistics on groups.
Currently, I got a list of all provider (if all of them outliers?) and list of codes marked as outliers but without connection to specific providers. Say, Code14 has 2 outliers in a range. Also, some lower bounds are negative?
Please, correct me on what I do wrong.
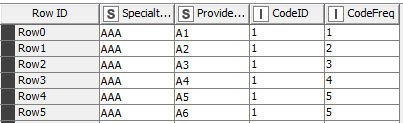
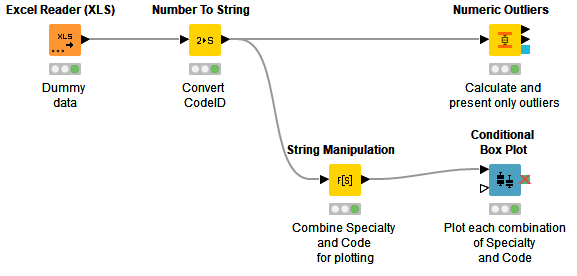
I put together a dummy dataset and sample workflow for you. I kept the data in your original format, prior to transposing. There are 2 specialties, with 10 providers and 2 code IDs for each. Here’s the abbreviated structure:
The workflow takes this data, calculates outliers, and also presents box plots for each combination of specialty and code:
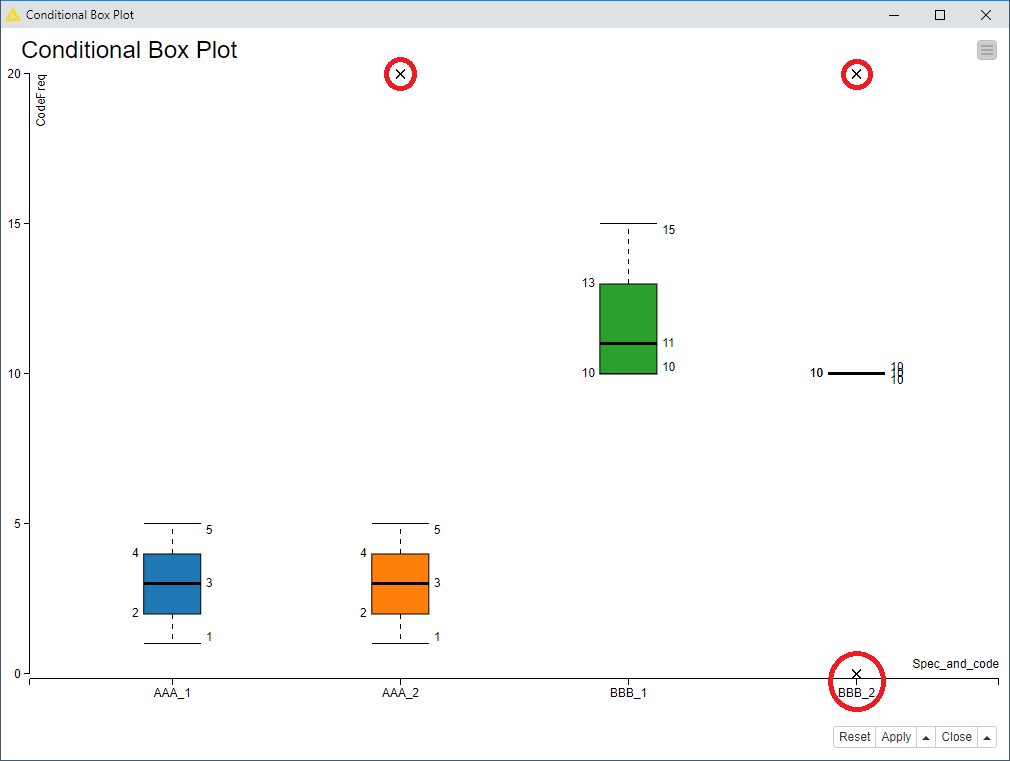
In the end, we have a conditional box plot that shows the three outliers I included in the data, indicated by the X marks:
You will see that these outliers match up with those identified by the Numeric Outliers node:
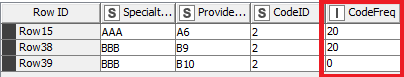
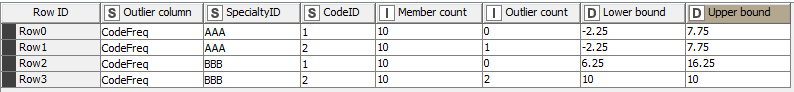
If you want a count of the outliers by specialty and code, along with the lower and upper bounds calculated for each, you can get those from the 2nd output port:
Lower negative bounds are not uncommon - you can see how they are calculated in the node description. It just means you have a lot of values in your group (relatively) close to zero.
Since we didn’t have a simple Numeric Outliers workflow on the Hub, I’ve uploaded this one here for those who may stumble across this thread:
Hope this helps - let me know if you have any more questions. Cheers!
@ScottF, I added to the example the way I did it. It’s because for my real data your way is not working at least for 3.7.2 version. With your data in 4.1 both give the same result.Numeric_Outliers_Simple_Example.knwf (61.7 KB)