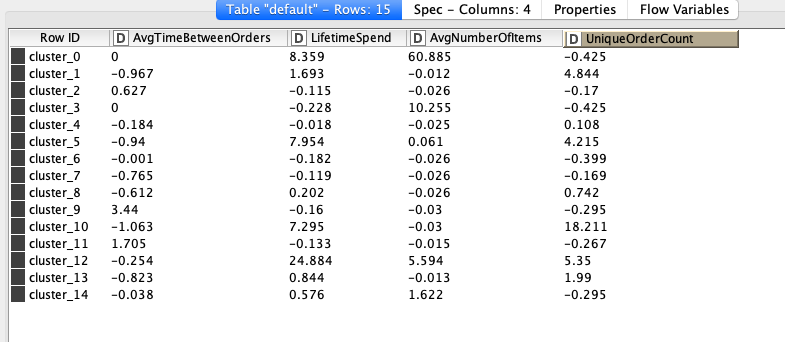
I have a question regarding customer clustering with the k-Means node which I have done according to the KNIME tutorial on a sample set of transactional data and get this cluster output:
Now from what I’m used to, a cluster is defined by ranges of values where each customer belongs to (for example Cluster 1 would be 1.6393 to 2 in LifetimeSpend) but in the k-Means output I only see a signal number. How do I then determine what characteristics are included in my cluster because a cluster can not have a signal value for each attribute (that would create to many clusters and by default defeat the purchase of creating clusters in the first place)?
Also, how do I evaluate the models effectives of creating good clusters or not?
The K-means algorithm does not specifically try to find parameter ranges for each cluster during the “learning” step but cluster centers. You can see those centers in the output you have posted.
If you want to find out which of the data points belong to which cluster, you can use the Cluster Assigner node. To group each cluster afterwards and find lower and upper bounds of the ranges, you can use the GroupBy node grouping by the clusters and aggregating to min and max values of each variable.
Evaluating your K-means results is a bit tricky because there are no clear heuristics and it depends heavily on your problem. A good approach is often to visualize your clusters and have a look at the results yourself. An example how you can do this in KNIME is on our example server and you can find it here: knime://EXAMPLES/04_Analytics/03_Clustering/01_Performing_a_k-Means_Clustering.
I hope this helps you. Let me know if you need further help!
Thanks for helping me out with this. I tried to follow the example you provided and this worked well. Just a quick follow-up question. In the k-Means node I have specified the number of clusters to 7 but on the output it has only assigned the following clusters:
cluster_2
cluster_3
cluster_4
cluster_6
Why is either cluster_1, cluster_5 and cluster_7 featured in the output?
Your problem sounds weird. I would expect to have all 7 clusters there, too. Is this the output of the k-Means node or of the Cluster Assigner node? During cluster assignment it could happen that none of the data points is assigned to one of the clusters.
If this is not the case, would you mind sharing your workflow with me, so that I can reproduce it?
I tried to GroupBy using the k-Means input and yes, you are right, when doing this all 7 clusters are featured in the output. So then I assume that two clusters are not ‘used’ when assigning clusters to the data set. Thanks for clarifying this.
Another two small follow-up question:
If I would like to rename the clusters from for example cluster_2 to Cluster 2, what would be the best way of doing so?
Also have a number of non-numeric attributes such as age brackets “18-24” that I would like to translate in to numerical data to then decode after the clusters are generated. Is there away to set this up dynamically to that each value inside an attribute gets a numeric number?
This worked perfectly, thanks for the tip. I a little bit stuck on how I should convert the numbers back to their original string values (i.e. query the String to Category output table to create a look up. Any ideas?
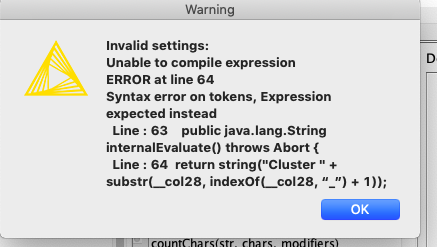
I think that’s because the formatting of the quote characters changed when I was copying the expression into this topic. Try this one instead: string("Cluster " + substr($Cluster$, indexOf($Cluster$, "_") + 1))
Take a look at the Number To Category (Apply) node. You can plug in the model created in the Category To Number node.
Thanks for the reply @SimonS . I have connected the Number To Category (Apply) node to the Category to Number node (blue input/output connector between each) and also used the numbered output as an input to Number To Category (Apply) (with the append column option enabled) but the output when I run this still only appended the numbered data and not the categories. Am I missing something in the sequencing of this perhaps?
Thanks @SimonS, that did the trick. One final small question, I wanted to see for example which “Gender” was most frequently featured in each cluster so I applied a GroupBy on “Cluster” and selected “Gender” in Manual Aggregation on “Maximum” but the issue I found is that “M” for male is the most frequent in all clusters.
Now that might actually be correct but I wanted to find out if Maximum in the aggregation will give me the most frequently featured value or if there is any other aggregation method better suited for this?
Glad it worked for you.
The “Maximum” gives you the maximum value which makes in terms of strings not a lot of sense. “M” is bigger than “F” and you will always get “M” as result. The aggregation function you are searching for is “Mode”. You can always get a hint what the functions is doing by hovering over it during the selection.