Hi all,
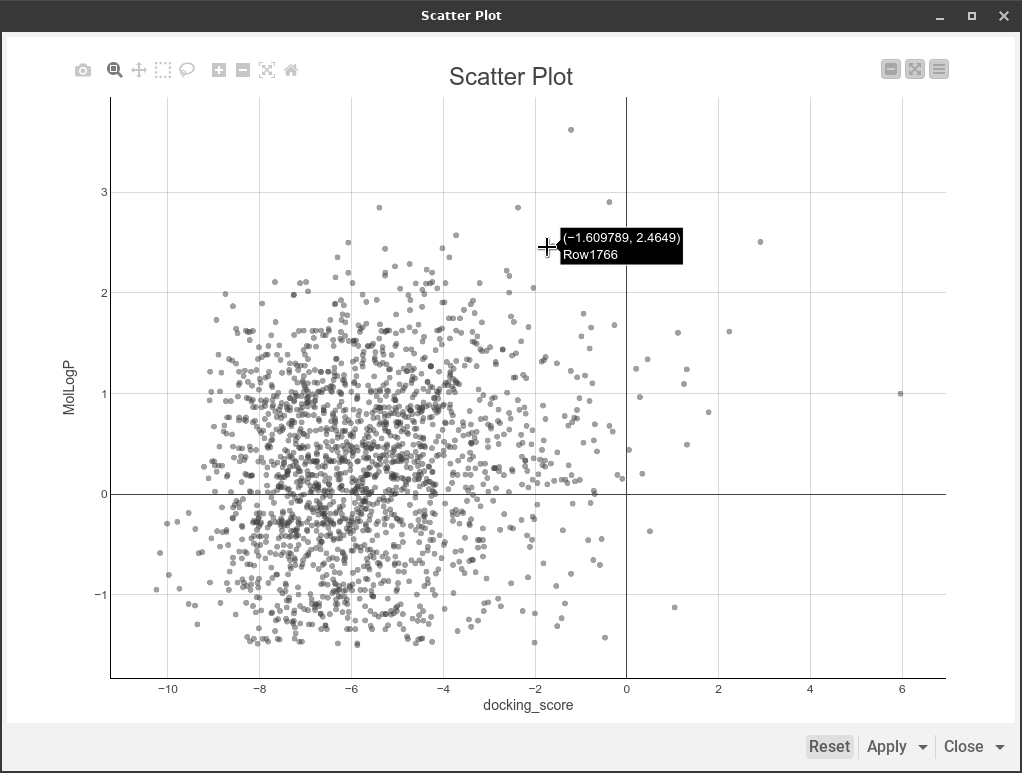
Is it possible to customize what a (plotly) scatter plot shows when hovering over a data point? I am thinking for example chemical structures.
Thanks/Evert
Hi all,
Is it possible to customize what a (plotly) scatter plot shows when hovering over a data point? I am thinking for example chemical structures.
Thanks/Evert
Hi @evert.homan_scilifelab.se -
Currently I don’t think this is possible within a single Scatter Plot.
What about creating a component with both a Scatter Plot and a Tile View (JavaScript) , so that you could highlight the chemical structure interactively?
This topic was automatically closed 90 days after the last reply. New replies are no longer allowed.