Hi all,
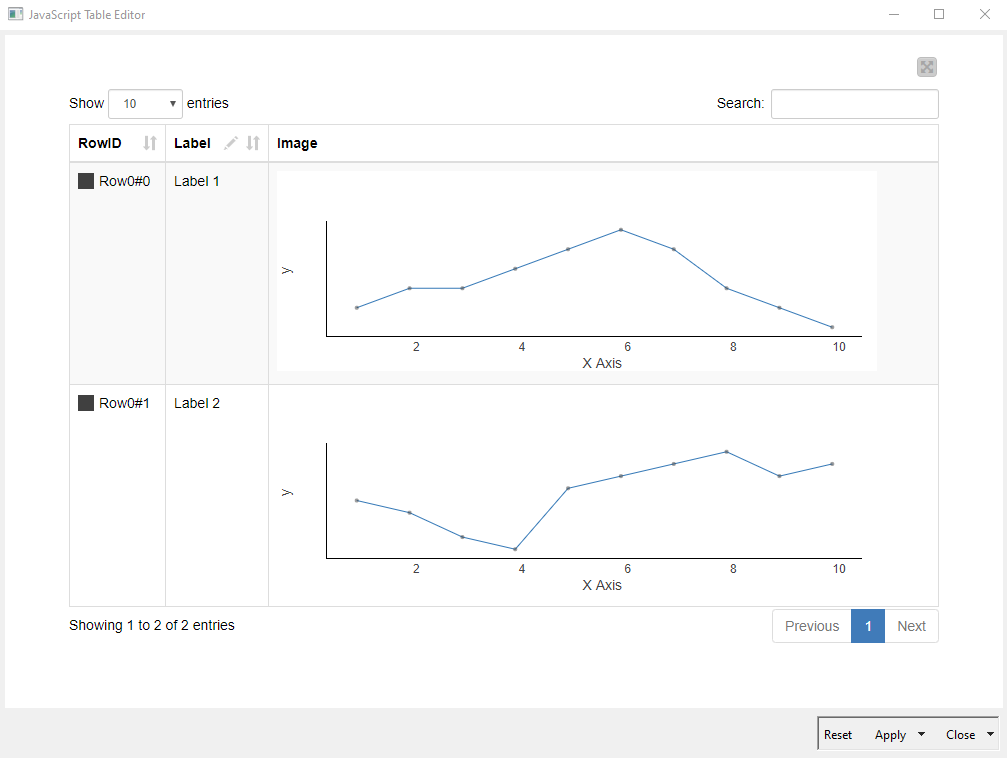
is it possible to show a line chart inline in a Table Editor:
Thanks,
Denis
Hi all,
is it possible to show a line chart inline in a Table Editor:
Thanks,
Denis
That is exactly what we want. Would it be possible to hide the axes somehow and show only the line?
Thanks a lot,
Denis
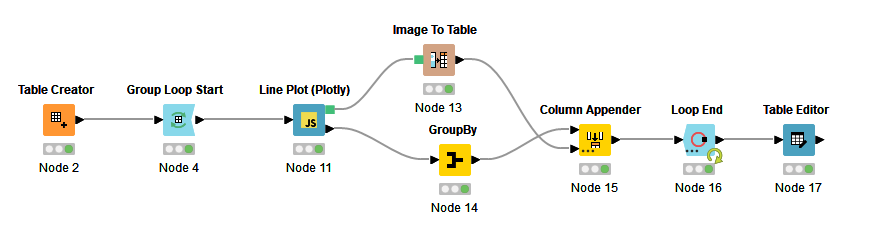
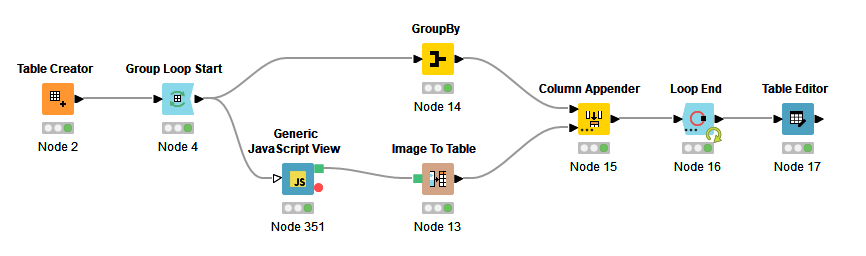
It is - here is a workflow that does it with plotly.js inside a ‘Generic JavaScript View’ node. I use that combo for 90%+ of my visualizations in KNIME because of it’s flexibility and formatting options.
The code for the SVG visualization is a new trick though that I borrowed from @swebb
This topic was automatically closed 7 days after the last reply. New replies are no longer allowed.