Hello.
I was wondering how to create a view node by using this code in document below:
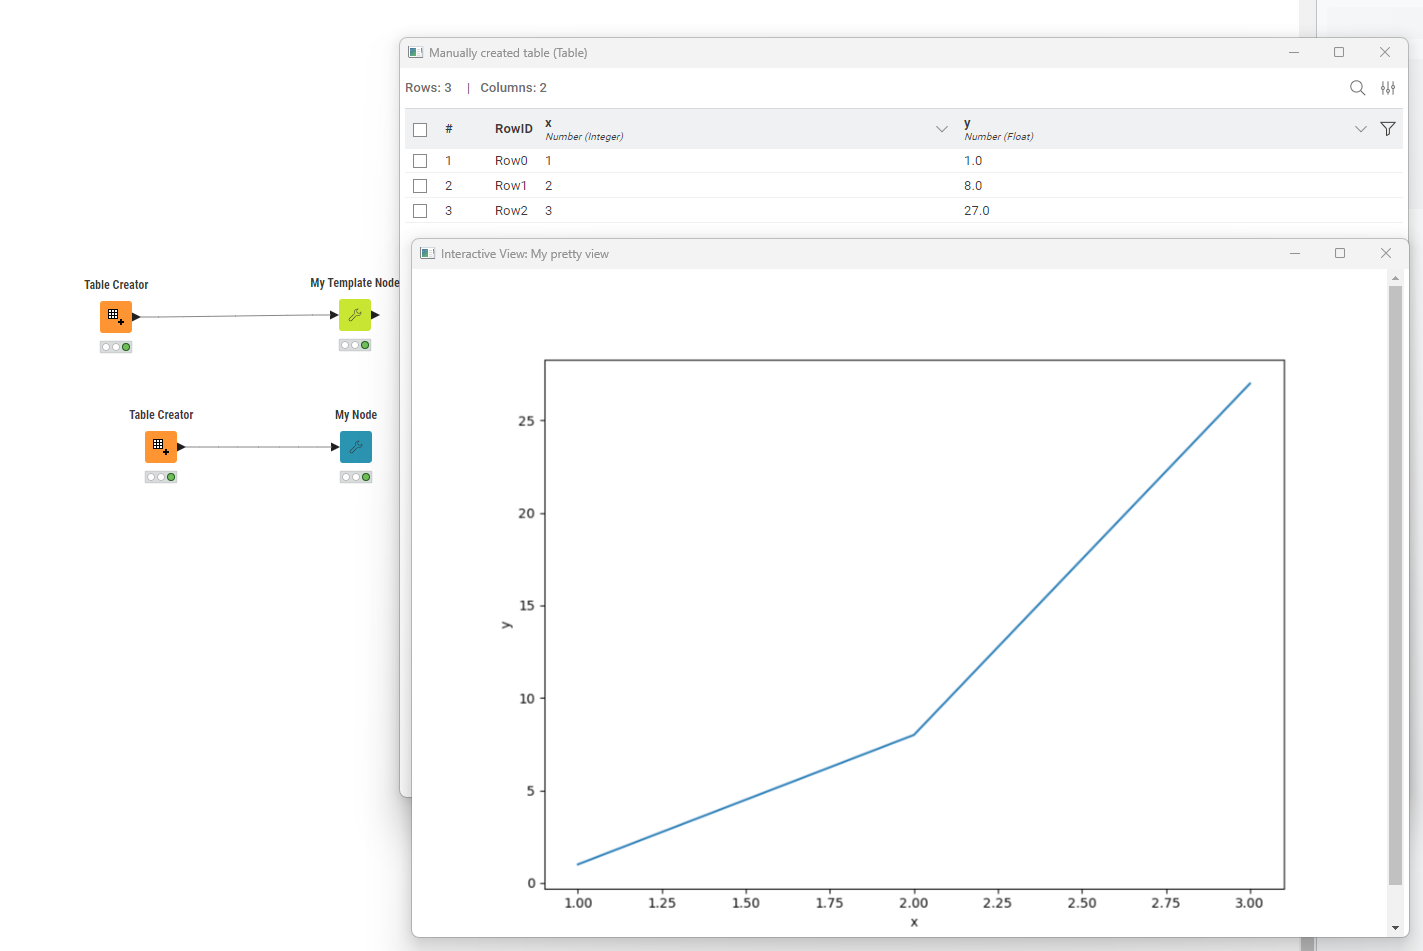
I have successfully created a simple input/output node, but I keep failing to create a chart node.
I would appreciate it if someone could help me.
from typing import List
import knime.extension as knext
import seaborn as sns


@knext.node(name="My Node", node_type=knext.NodeType.VISUALIZER, icon_path="icon.png", category="/")
@knext.input_table(name="Input Data", description="We read data from here")
@knext.output_view(name="My pretty view", description="Showing a seaborn plot")
class MyViewNode:
    """
    A view node

    This node shows a plot.
    """

    def configure(self, config_context, input_table_schema)
        pass

    def execute(self, exec_context, table):
        df = table.to_pandas()
        sns.lineplot(x="x", y="y", data=df)
        return knext.view_seaborn()

        # If the node outputs tables, the output view must
        # be the last element of the return value
        #
        # output_table = knext.from_pandas(df)
        # return output_table, knext.view_seaborn()
        #
        # For multiple table outputs use
        # return output_table_1, output_table_2, knext.view_seaborn()