I have been using the Sunburst Chart (JavaScript) node in KNIME to create interactive sunburst charts. In particular, I built web app pages (e.g., in KNIME WebPortal) where after a user clicked or selected segments of the sunburst chart, the corresponding subset of data was dynamically shown in an associated table. This interactivity was really valuable for data exploration and dashboarding.
Recently, the Sunburst Chart (JavaScript) node became deprecated (i.e. a legacy node is still available) and replaced by the new Sunburst Chart node. However, I’ve noticed that the new node generates nice visualisations but does not seem to support clicking or selecting sunburst segments to filter or update other views downstream.
Is there a recommended way or best practice in current KNIME versions to replicate the interactive behaviour where clicking on sunburst segments updates tables or filters data dynamically?
Are there any built-in nodes, extensions, or demo workflows that showcase how to bind the sunburst chart segment selection to downstream filtering in dashboards or WebPortal components?
Thanks a lot in advance for your help! I’d appreciate pointers on how others have overcome this limitation.
with KNIME nodes, we usually follow a two-step model for deprecation:
Legacy nodes are still perfectly fine to be used, but there is a newer node that offers most of the features. If you build a new workflow, we recommend to use the new node, unless you require some of the missing functionality.
Deprecated nodes usually continue to work, however, you definitely should use the newer node.
In your case, the selection for the Sunburst chart has not been implemented yet. I added a +1 for you to the ticket (internal reference UIEXT-1195), but for the time being, you will need to continue using the legacy node.
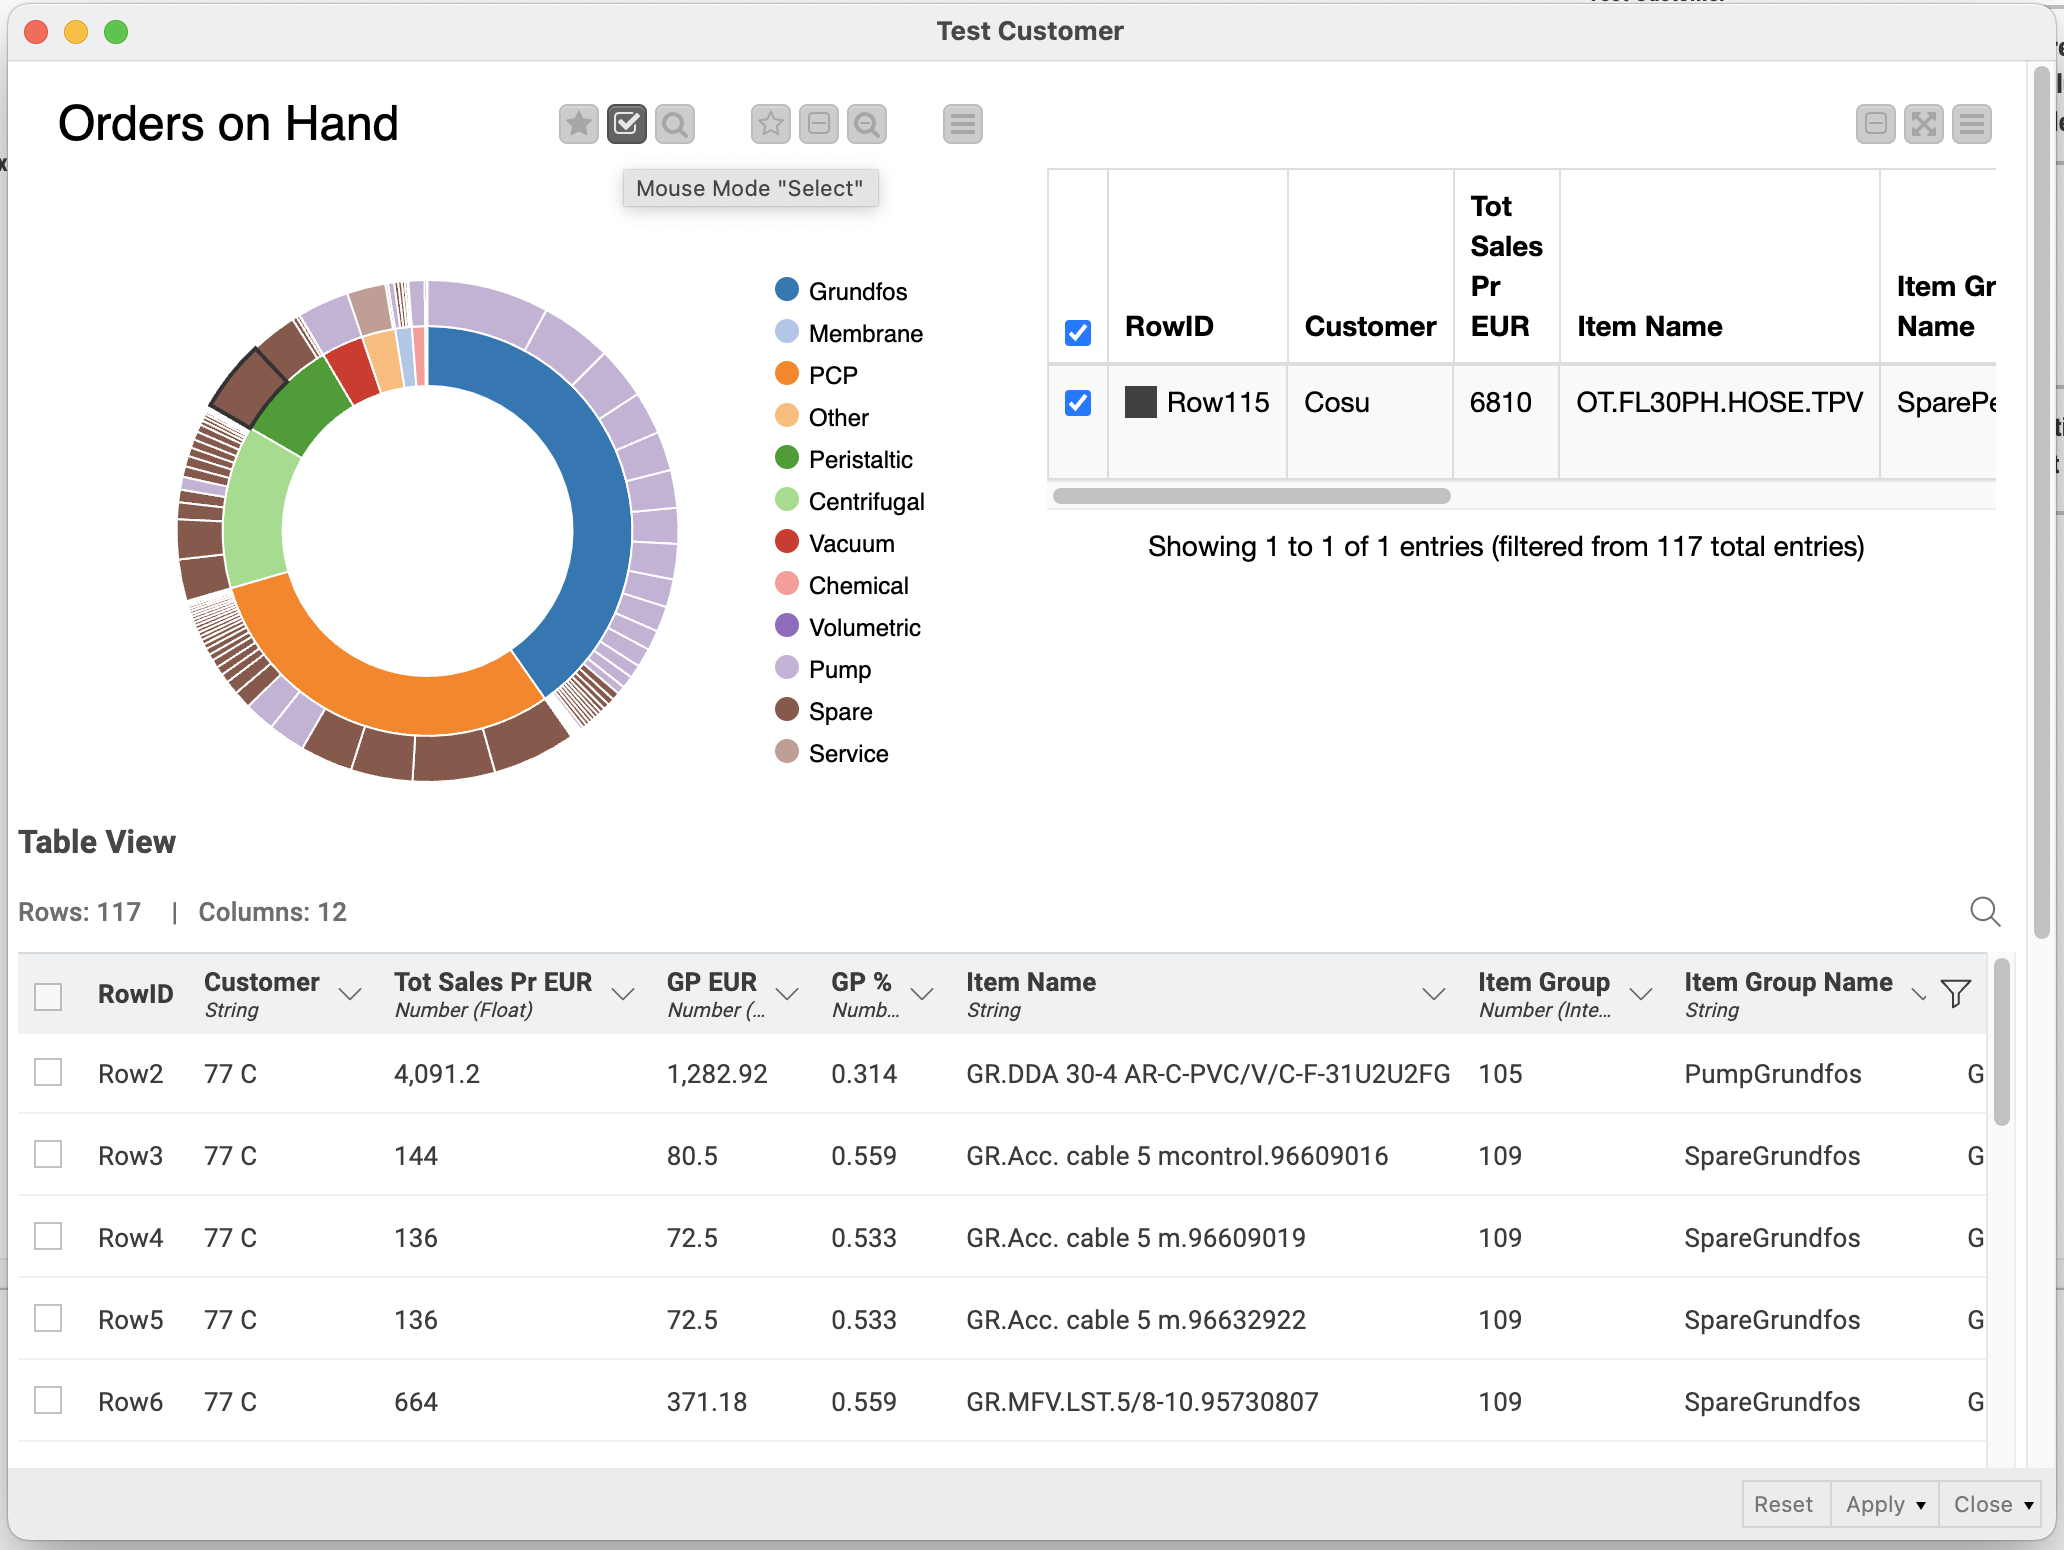
Here is the typical workflow. It looks pretty simple, but I cannot get the Sunburst chart to work nicely, with a little bit of clean format for numbers, proper labels.
And I cannot get the table connected to the Sunburst Chart to show the content of the selected subset of the Sunburst.
I slightly adjusted your example to show only the selected rows in the table downstream. You have to make sure that for the “selection“ to work you have the selection mode activated in the sunburst chart.