Hellow 
Is there a way to use the ‘Interactive Value Filter Widget’ node to filter categorical data from two charts in a web portal immediately?
Hellow
Is there a way to use the ‘Interactive Value Filter Widget’ node to filter categorical data from two charts in a web portal immediately?
Hi,
thanks for your question.
Yes, if I understood you correctly, this is possible.
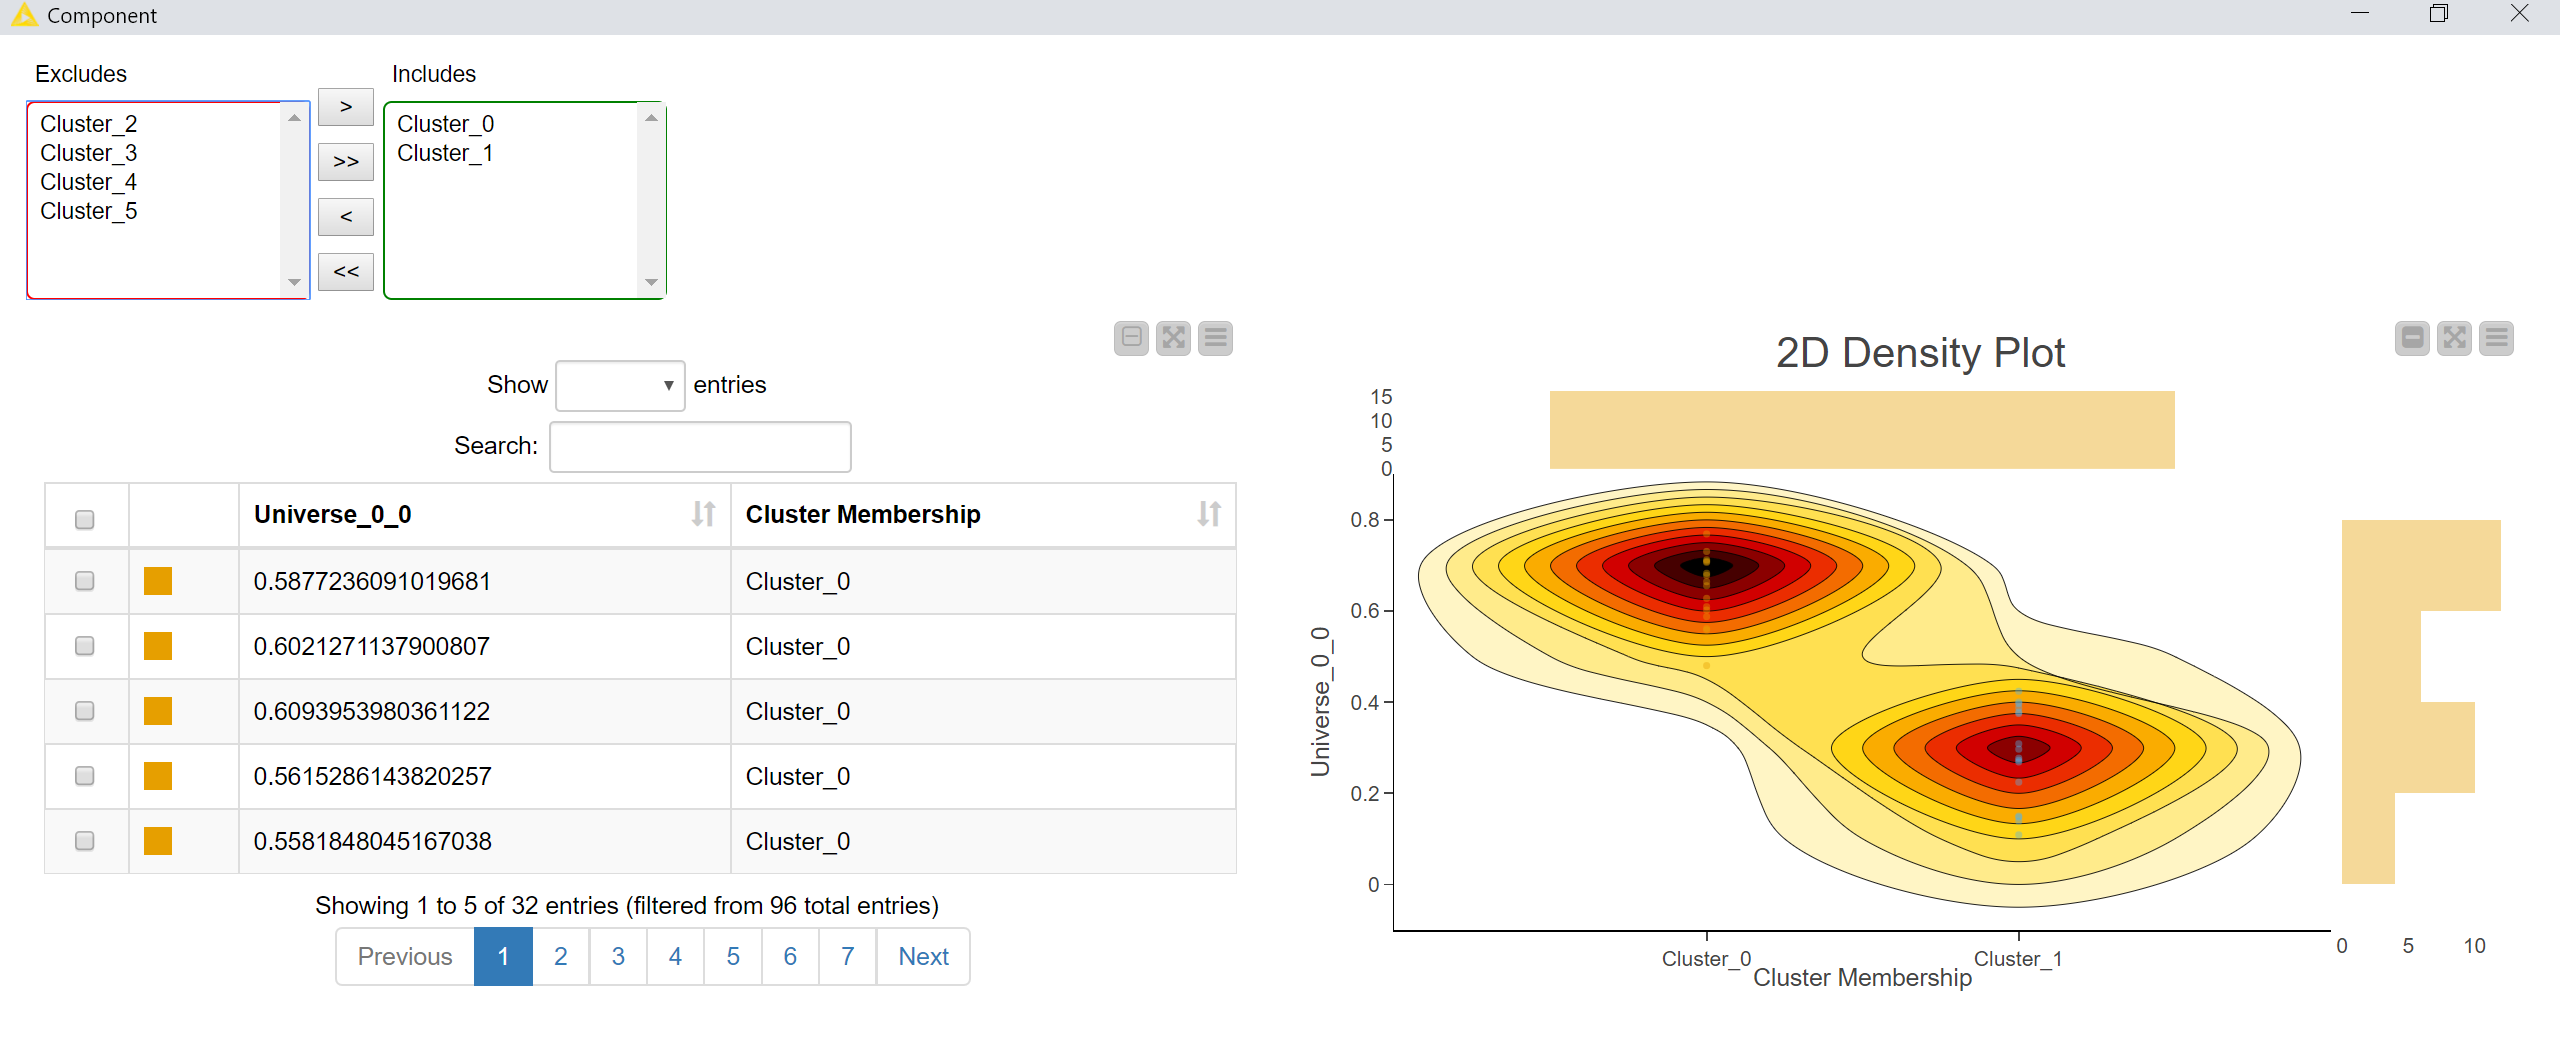
I attached an example workflow with a component. If you do a right-click and open the interactive view of that component you will be able to select/deselect categorical data from a table and a density plot using the Twinlist of the Interactive Value Filter Widget.
Interactive_value_filter_widget_example.knwf (19.5 KB)
Would look like here for example:
To make plots and table views working interactively together you need to put them into a component. If you need some additional material about that please let me know.
Best,
Martyna
And of course, because you asked for filtering two charts, you could replace the table view by another chart and it would work like with the density plot as well.
Thank you!!
have a good day
But there is a chart that does not apply the ‘Interactive Value Filter Widget’ node…

Which one do you mean?