Hey everybody,
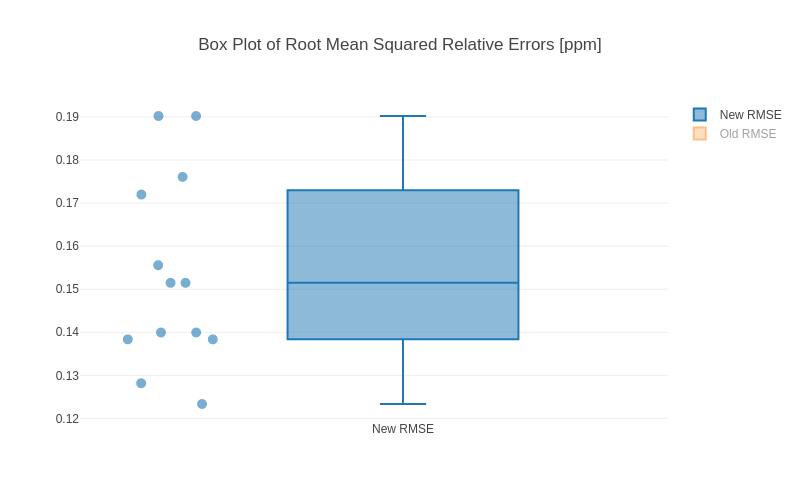
I have some troubles combining the interactivity of standard KNIME nodes and the Generic JavaScript View. I want to show a table (Table View node) and a box plot of values (Plotly box plot in Generic JavaScript view) on the same page and interaction between these two elements.
I would like to select rows in the table when data points in the plot are selected. It would be great to have the vice versa functionality to highlight data points in the plot if the corresponding row is selected, but this is additional.
Without any deeper knowledge in front end development I came quite far with the plot itself. But know I’m struggling to connect both features. Is there any documentation on that topic, can someone share a working example, or even better: adapt my workflow/code below?
Thanks in advance,
Best, J
Image of the plot:
Here is my dummy workflow for the problem:
Interactive Box Plot.knwf (14.7 KB)
Here is the code of the Generic JavaScript View:
// **************
// *  VARIABLES *
// **************

// Input data

// Read the input KNIME data table to kdt
var kdt = knimeDataTable;

// Read column "Measurement" to measurement_names
var measurement_names = kdt.getColumn(kdt.getColumnNames().indexOf("Measurement"));

// Read column "Old RMSE" to old_rmse_values
var old_rmse_values = kdt.getColumn(kdt.getColumnNames().indexOf("Old RMSE"));

// Read column "New RMSE" to new_rmse_values
var new_rmse_values = kdt.getColumn(kdt.getColumnNames().indexOf("New RMSE"));


// Layout parameters

// Set plot title
var plot_title = 'Box Plot of Root Mean Squared Relative Errors [ppm]';

// Set plot width
var plot_width = 800; // Set plot_export_width to integer if set to "auto"

// Set plot height
var plot_height = 500; // Set plot_export_height to integer if set to "auto"

// Set wisker width
var whisker_width = 0.2;


// Config parameters

// Set plot export filename
var plot_export_filename = 'calibration_rmse_boxplot';

// Set plot export format
var plot_export_format = 'svg'; // Available formats: png, svg, jpeg, webp

// Set plot export width
var plot_export_width = plot_width; // Set to integer if plot_export_width is "auto"

// Set plot export height
var plot_export_height = plot_height; // Set to integer if plot_export_height is "auto"

// Set the option to edit the plot
var plot_editable = false; // true or false


// ********
// * PLOT *
// ********

// Traces

// Trace 1 - Boxplot of new RMSE with jittered data
// points showing measurement names
var trace1 = {
	type: 'box',
	y: new_rmse_values,
	boxpoints: 'all',
	jitter: 0.5,
	pointpos: -2.0, // Value between -2.0 and 2.0
	name: 'New RMSE',
	hoverinfo: "all",
	hovertext: measurement_names,
	whiskerwidth: whisker_width,
	marker: {
		size: 10,
		opacity: .6
	}
};

// Trace 2 - Boxplot of old RMSE, which is by default
// not shown
var trace2 = {
	y: old_rmse_values,
	visible: "legendonly",
  	type: 'box',
	name: 'Old RMSE',
	boxpoints: 'Outliers', // Show only outliers as points
	hoverinfo: "all",
	hovertext: measurement_names,
	whiskerwidth: whisker_width
};

// Combine all three traces into data
var data = [trace1, trace2];


// Layout

// Set the general plot layout
var layout = {
	legend: true,
	title: plot_title,
	yaxis: {
		//rangemode: 'tozero',
		autorange: true
	},
	hovermode: 'closest', // Modes: 'closest', 'compare'
	dragmode: 'lasso',
	width: plot_width,
	height: plot_height
};

// Config

// Set the general plot configuration
var config = {
	toImageButtonOptions: {
		format: plot_export_format,
		filename: plot_export_filename,
		height: plot_export_height,
		width: plot_export_width,
		scale: 1, // Multiply title/legend/axis/canvas sizes by this factor
	},
	displaylogo: false,
	editable: plot_editable,
	modeBarButtons: [['toImage', 'lasso2d', 'zoom2d', 'zoomIn2d', 'zoomOut2d', 'resetScale2d']]
}

// ********
// * MAIN *
// ********

//Create the plotly HTML element
var div = document.createElement('DIV');
div.setAttribute('id', 'rmse_boxplot');
document.body.append(div);

// Create the plot
Plotly.newPlot('rmse_boxplot', data, layout, config);

/*
//Knime selection event publishing; selection events
document.getElementById('rmse_boxplot').on('plotly_click', function (eventData) {
    if (!eventData) {
        return;
    }

    var selection = [];

    eventData.points.forEach(function (pt) {
        selection.push(pt.data.id[pt.pointIndex]);
    });

    knimeService.setSelectedRows(knimeDataTable.getTableId(), selection);
});

//Knime selection event publishing; de-selection events
document.getElementById('rmse_boxplot').on('plotly_deselect', function () {
    knimeService.setSelectedRows(knimeDataTable.getTableId(), []);
});

*/

document.getElementById('rmse_boxplot').on('plotly_selected', function(eventData) {
    var selectedPoints = eventData.points;

    // Get the trace indices of the selected points
    var selectedIndices = selectedPoints.map(function(point) {
        return point.curveNumber;
    });

    // Create an array to hold the opacity values for all points in trace1
    var opacityValues = new Array(new_rmse_values.length).fill(0.6); // Set the default opacity (0.6)

    // Set the opacity of the selected points to 1 (fully opaque)
    selectedIndices.forEach(function(index) {
        selectedPoints.forEach(function(point) {
            if (point.curveNumber === index) {
                opacityValues[point.pointIndex] = 1.0;
            }
        });
    });

    // Update the marker opacity of trace1 with the new opacity values
    Plotly.restyle('rmse_boxplot', {'marker.opacity': [opacityValues]}, [0]);
});