Is it possible to create Excel function TRIMMEAN in knime?

Hello everybody!

I would like to know if it is possible to create Excel’s TRIMMEAN function in knime?

Description Function

Returns the mean of the interior of a data set. TRIMMEAN calculates the mean taken by excluding a percentage of data points from the top and bottom tails of a data set. You can use this function when you wish to exclude outlying data from your analysis.

font: TRIMMEAN function - Microsoft Support

You can find Mean under the “aggregation” tab in the GroupBy node. (Just don’t select any columns the “Groups” tab) As long as the column is numerical then it should be an option.

@gabrielfs2

not sure if it completely mimics your TRIMMEAN behaviour, but just slicing records of the top and bottom of a table seems a bit of a blunt way to remove outliers.

what I typically do in that case is use the ‘robust statistics’ from the boxplot node

this will give me the cut-off values for 1st and 3rd quartiles (IQR) of the boxplot whiskers and just remove anything that doesn’t fit in between.

Just a proposal, see if it works for you!

Herman

You could always do it as a process as well. Calculate the number of values to be trimmed from top or bottom by percentage you are targeting, subtract the bottom trim amount from the total table length, then use both as flow variables to control a row filter node and trim top and bottom, then calculate mean via GroupBy node on the remaining values.

If you use it regularly then it would be a good idea to wrap it into a simple component.

2 Likes

Either flow variable controlled or not, the top K node can also be of use here.

Example on random number range from 0 - 100000. With the subsequent left anti join you can exclude the found records.

5 Likes

thx @ArjenEX ! didn’t know the ‘top K selector’ node existed!

I always used the ‘Sorter’ + ‘Sampling’ node combo to do this, but the top-k one combines them neatly

Herman

3 Likes

Indeed, it’s a quite unknown node but according to the description it’s the most efficient way (not considering the boxplot route which is also a nice way)

The node behaves the same as a combination of the Sorter node followed by a Row Filter that only keeps the first k rows of the table except for the order of the rows which depends on the Output order settings. Note, however, that the implementation of this node is more efficient then the node combination above.

1 Like

@gabrielfs2

Yes, it is possible to create Excel’s TRIMMEAN function in KNIME. I offer two possibilities below.

The TLDR:

  • KNIME implementation of the node is here.
  • Python implementation of the node is here.

I have included a Python implementation as there are many on the forum who are interested in developing nodes using Python and would like to see a comparison between the two approaches.

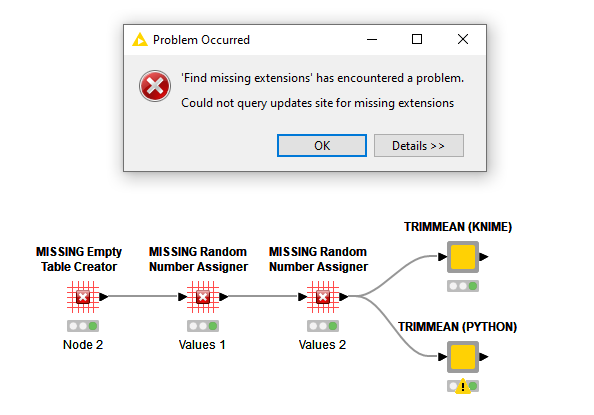
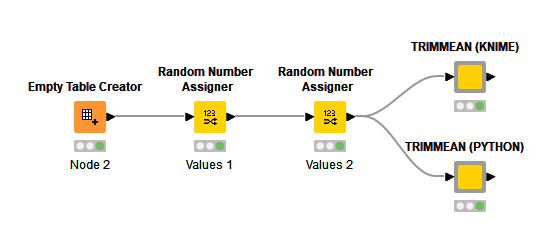
The basic test workflow, available on the hub, is shown below. An empty table is created with 3,000 rows. Then two random number assigners fill two columns with numbers between 0 and 1,000. This data is then fed to each node. The nodes have configuration to select the numeric columns for which TRIMMEAN is to be calculated and the percentage (as decimal fraction between 0. and 1.) of values to drop.
Screenshot_20230114_144413

KNIME Component

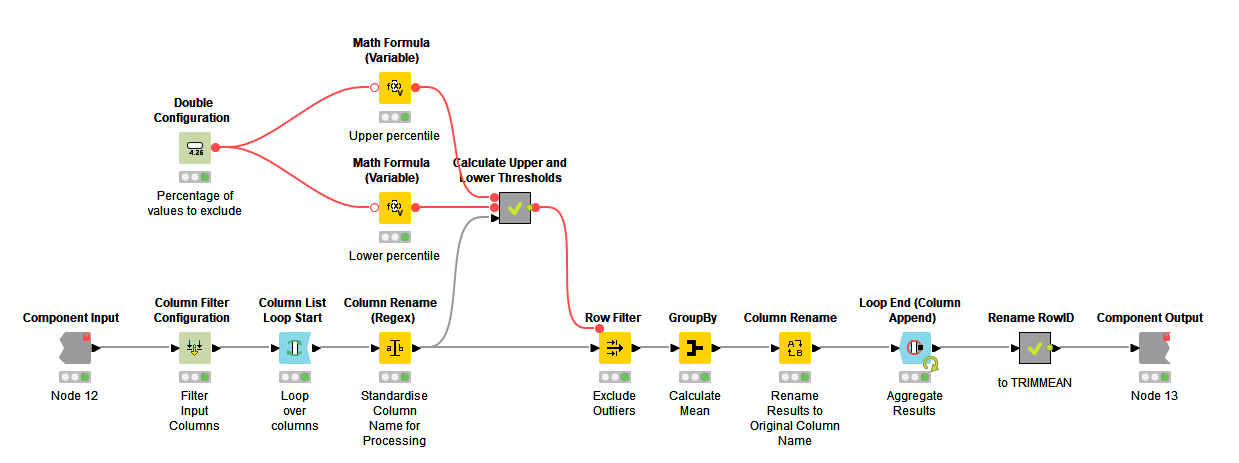
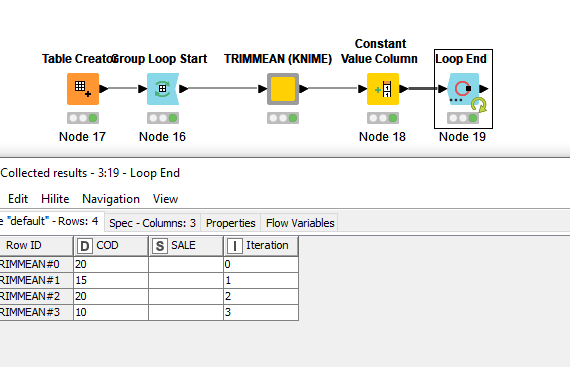
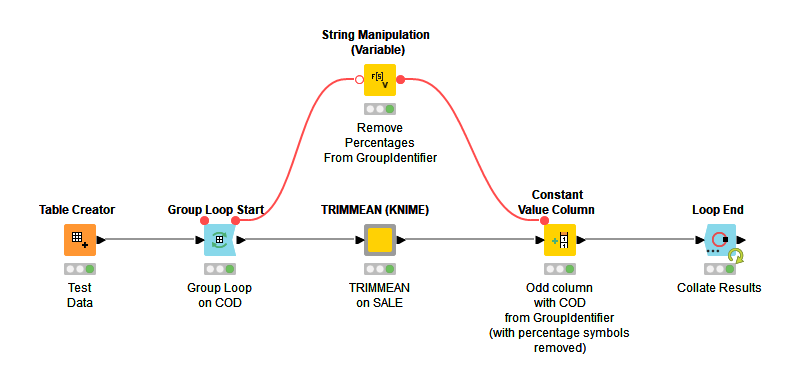
The KNIME component filters the input table and iterates over each column (blue nodes). The final metanode is to rename the RowID to TRIMMEAN.

The core of the workflow is:

  • Take the percentage of values to be removed p and calculate the upper (1 - p / 2)and lower quantiles (p / 2).
  • These thresholds are then used in GroupBy nodes to calculate the threshold value for the quantiles. The manual aggregation method is quantile and the threshold is set by a flow variable.
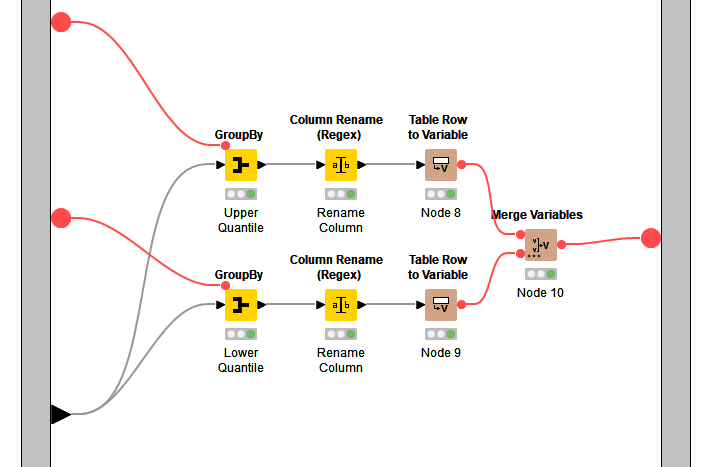
  • Note, whilst calculating both upper and lower quartile could be done in one GroupBy node, it is very cumbersome to rename the output columns to distinguish the values.
  • Second note, this workflow could be done without a loop, however, the quantile method requires parameters which cannot be passed as a set, therefore preventing programmatically selecting columns, methods and parameters at run-time (bit of a very very detailed implementation problem, so not relevant to most people).
  • Once the upper and lower threshold values for the quantiles are calculated they are passed to a row filter to filter the data between these two values.
  • A GroupBy node is then use to calculate the mean of the remaining values.
    The column is renamed back to the original column name, and each column is then appended to the output data table.

Details of the Calculate Upper and Lower Thresholds metanode.

Python Component

The KNIME nodes in the Python version of the component are much simpler, consisting of configuration nodes and Python script node.

image

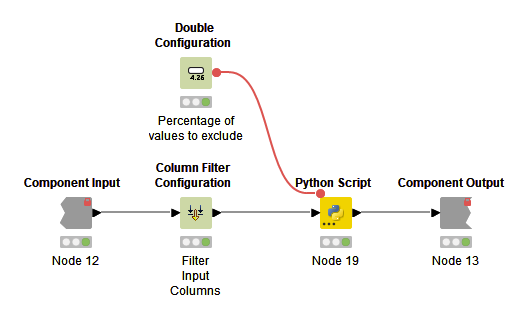
The Python script is below. The workflow is very similar to the KNIME workflow. When reading the script note the use of plurals. By convention, plural variable names are used in Python scripts to indicate multiple values (such as lists, dictionaries) whereas single values are not pluralised.

  • The script imports the data into a Pandas dataFrame df.
  • It then calculates the upper and lower thresholds for each column in the dataFrame.
  • It then iterates over each column creating a filter expression to filter the data.
  • The mean is then calculated by taking the dataFrame df, selecting the column in the iteration variable column, selecting the required values with filter and then calculating the mean .mean().
  • The values are stored in a dictionary trim_mean_values.

The only twist on most Python scripts implemented in Python nodes is that after converting the dictionary of TRIMMEAN values for each column the dataFrame is transposed to match the same format output as the KNIME node - if the data is not transposed then their is one TRIMMEAN column with a row for each column value.

import knime.scripting.io as knio
import pandas as pd

# Import data as a Pandas dataFrame
df = knio.input_tables[0].to_pandas()

# Calculate upper quantiles and value of upper thresholds
upper_quantiles = 1 - (knio.flow_variables['percent-to-excude'] / 2)
upper_thresholds = df.quantile(q=upper_quantiles, interpolation="linear")

# Calculate lower quantiles and value of lower thresholds
lower_quantiles = knio.flow_variables['percent-to-excude'] / 2
lower_thresholds = df.quantiles(q=lower_quantiles, interpolation="linear")

# Iterate over columns, filter data and calculate mean.
trim_mean_values = {}
for column in df.columns:
    lower_threshold = lower_thresholds[column]
    upper_threshold = upper_thresholds[column]
    filter = (df[column] > lower_threshold) & (df[column] < upper_threshold)
    trim_mean_values[column] = df[column][filter].mean()

# Create output dataFrame and transpose to match KNIME implementation
output_table = pd.DataFrame({"TRIMEMEAN" : trim_mean_values}).transpose()

# Export TRIMMEAN values on output port
knio.output_tables[0] = knio.Table.from_pandas(output_table)

Hope that helps

DiaAzul
LinkedIn | Medium | GitHub

7 Likes

@DiaAzul

when trying to open the workflow it shows this error, can you tell me how to install the extension?

Screenshot_1

@gabrielfs2

KNIME has identified that it needs to download additional components. If you answer yes, it will download those components and install them auto-magically. After it has downloaded the components it will prompt to restart KNIME so they become available, at which point you can load the workflow and it should run

@DiaAzul

when confirming an error message appears, I believe it could be a blockade from my company or lack of configuration, is there another way to download? or solve?

image

@gabrielfs2

If you click on the Details>> button it will provide more information which might explain what is happening.

If you are working on a corporate network with a firewall then you may need to discuss with them whether they can proxy the requests to KNIME servers. I can’t recommend anything which circumvents your organisation’s corporate IT security policies.

You may want to check you KNIME configuration. If you open the File->preferences->Install/Update->Available Software Sites. Then you should have the KNIME Analytics Platform and Trusted Community Extensions selected (I have a couple of other sites selected which you might not see).

If you open File->Install KNIME extensions and type Data Generation into the search box you should see the KNIME Data Generation package in the list. If you select that package and click next/finish then it should install the necessary nodes.

Otherwise, turn everything off and back on again. Make a cup of tea. Try again after ten minutes before you call the IT department :rofl:.

DiaAzul
LinkedIn | Medium | GitHub

4 Likes

@DiaAzul

I was able to install this extension, thank you very much!!

However, I would like to know if you have the possibility of using a column as a reference, like the example in the print below, I have a code and my sale, I would like to perform a Trimmean for each individual code

image

@gabrielfs2

You can put the TRIMMEAN in a group loop and iterate over the codes. You may need a constant value node to add a column with the code value so that you can associate the mean with the code at the end of the loop.

DiaAzul

3 Likes

For some reason it didn’t work, could you help me?

image

Trimmean2.knwf (90.9 KB)

@gabrielfs2

Modified workflow attached:
Trimmean3.knwf (48.6 KB)

Changes:

  1. You need to select have the grouping variable in the include box. The categories from this column will determine the grouping of the rows. Note that I have also selected Enforce Inclusion. It is worth understanding into which category (Exclude or Include) KNIME adds new columns if they are added to your workflow. If you select Enforce Inclusion then any new columns are added to the Exclude list. If you Enforce exclusion, then new columns are added to the include list. If, when you are creating bigger workflows you do not want to add new grouping categories then you will need to select Enforce inclusion to ensure that they are always excluded. Many is the time that adding additional columns (by design, or accident) has caused problems when those columns are added in the wrong category.

  1. TRIMMEAN node I put SALE under the include category and COD under the exclude. I am assuming you want to TRIMMEAN the SALE. It might be counter-intuitive, but the node selects values from the columns on the right, not the left.

Screenshot_20230115_230009

  1. I set the Constant Value Column to append a new column (COD) and set the value of that column to the variable GroupIdentifier (if you push the V button to the left of the line that starts with the Value settings dialogue you will get a modal dialogue with a drop down to select the variable. The warning at the bottom shows that the value is set by a variable.

  2. I also added a string manipulation (Variable) node because KNIME (rather unhelpfully) encloses the group name (GoupIdentifer) variable in percentage symbols (grrrr!).

  3. Loop End. What you had was fine. I have a preference for Generating new row IDs and unchecking the Add iteration column option so changed those options.

  4. I also changed the data type of the COD column from Double to Integer (formats nicer without the decimals), you could also change it to string (depends upon the nature of your codes). To change the type of the column open the table, double-click on the column heading. A modal dialogue box will open and you can select the data type of your column.

Hope that helps

DiaAzul
LinkedIn | Medium | GitHub

4 Likes

This topic was automatically closed 7 days after the last reply. New replies are no longer allowed.