I’m quite new to KNIME so this might be a dumb question.
However, I ran into a problem where I cannot preset a value to be displayed on the graph axis.
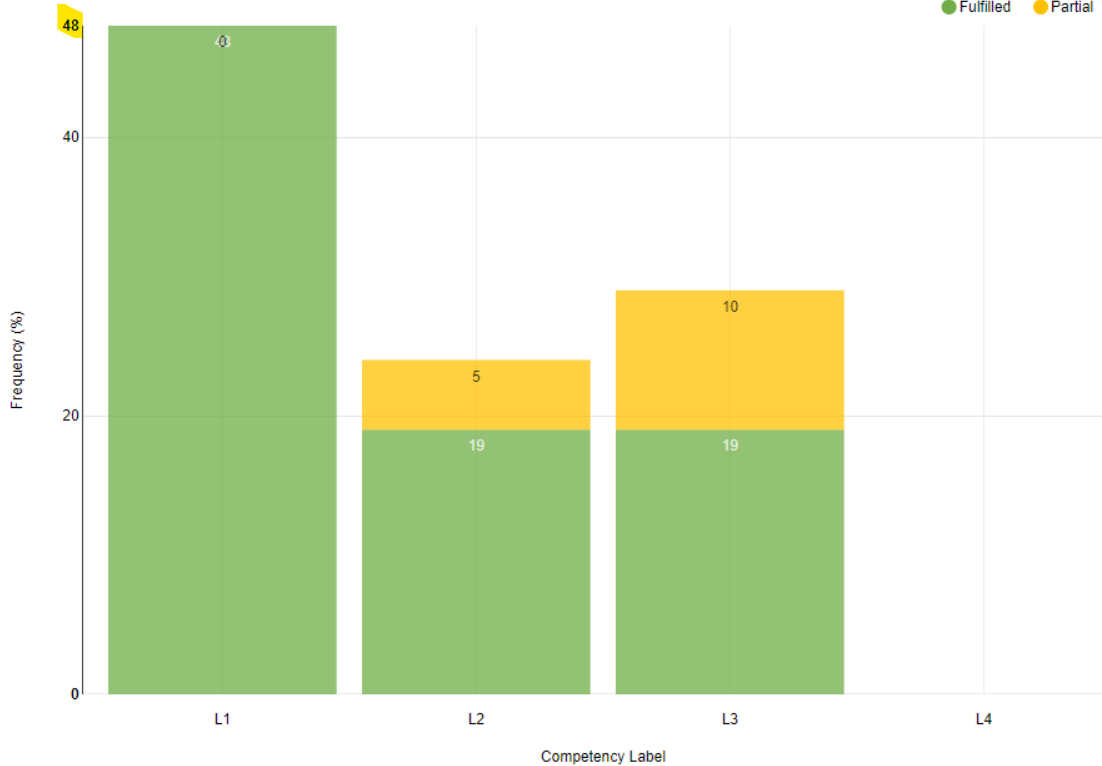
For example, in this graph I would like the y-axis to be set to a fixed value of 100(%), so that it can be compared with other tables. However, it caps at the highest value of any bar in the graph, in this case it’s 48.
Any help that is available I would greatly appreciate. Thank you and have a blessed day
At the moment, this is not possible with our bar charts. However, we have created a ticket to implement this feature in the “Bar Chart” Node. As a solution I invite you to explore the other visualisation nodes to present this information.
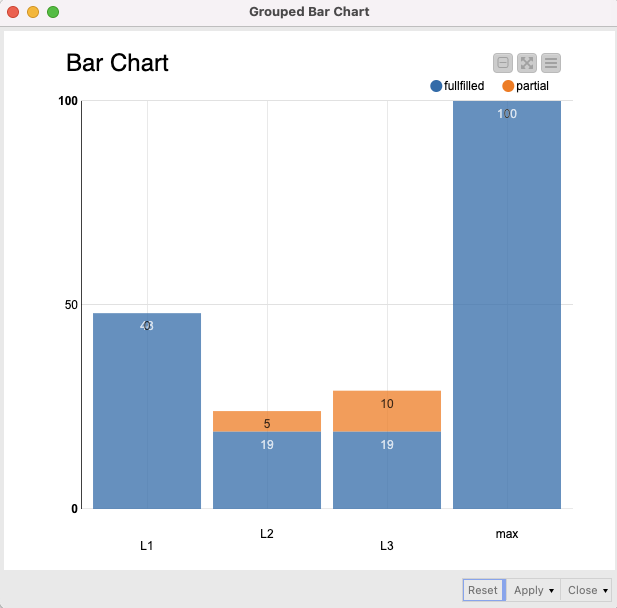
Alternatively (far from optimal) you can create a row with the maximum value of 100.