Hi.
I’m Mos
Is there a way to put together graphs drawn as line plots?
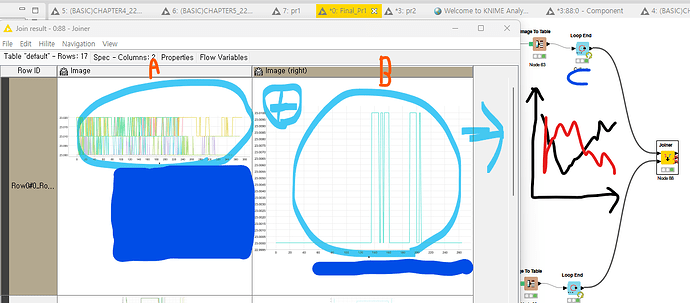
If there is a way, I would like to know how I can combine the graphs of two groups A and B, each with 17 graphs.
Thank you.
Hi,
Can you give us an example how that would look like? Do you mean a single line plot with 17 lines in one color and 17 lines in another color?
Kind regards,
Alexander
Hi,
If I interpret this correctly, you want to simply add the lines from one plot to the other. It is not possible to merge finished plots, but you can create a new table with the columns from both tables and then plot that. This should give you the desired result.
Kind regards,
Alexander
HI.
That’s right. My purpose is to add another graph to one graph.
What is the method?
Thank you.
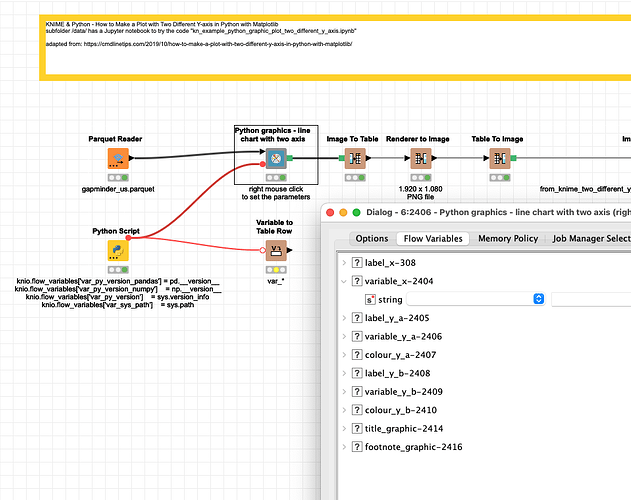
@kimv4 what I would do is use the embedded Python extension and let ChatGPT write the code for Matplotlib or Seaborn and add some Flow Variables to provide the column names to use. In your case for a loop.
So you could combine the power of KNIME and Phyton:
Maybe you can provide a sample dataset and a description what you want to see.
Hi @mlauber71.
Ummm. It doesn’t work out the way you told me, is there any other simple way?
Thank you.
@kimv4 maybe you did not fully explore all options in the last hour. Can you provide a sample dataset that would represent what you want and a more detailed description what the result should be?
Hi. @mlauber71
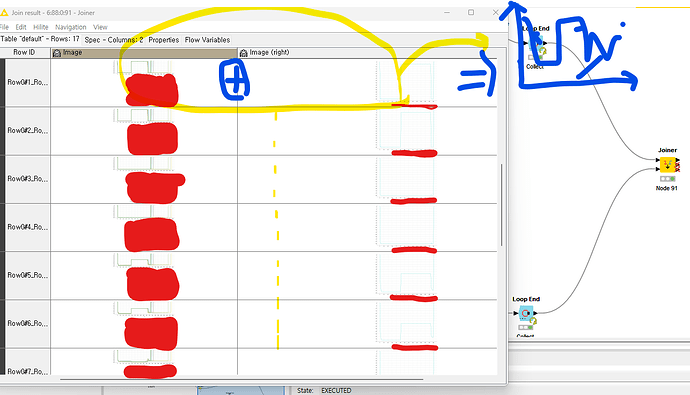
If I have graphs A and B, my goal is to make a new graph that combines these two graphs. And for me, my second goal is to make 17 of these graphs in total. I attach a picture.
For example, my goal is to draw graphs together using Hold on Code in Matlab.
Thank you.
Hi,
As said, you cannot merge graphs, but you can merge the 2 tables for the graphs and then plot a single graph with all columns. Please find an example attached.
Alexander
Merged Graphs.knwf (92.4 KB)
Hi.
Then, is there a flow that puts one different column data between the 17 chunking column data? I’m sorry, but I can’t make the desired result with the method you told me.
Thank you.
Hi,
I would bring the table into a different format first, where you have the 17 columns + a column denoting the Plot number. Then you can add to those 17 columns the additional columns of the second plot. Then you can use a Group Loop Start node to loop through the rows corresponding to individual plots, run the Line Plot, and collect the images.
Kind regards,
Alexander
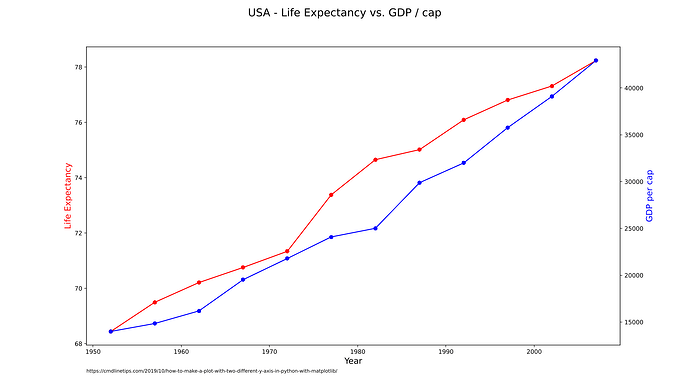
@kimv4 you could adapt this example. The two y-axis could be inserted via Flow Variable from a loop and an individual name could be given for the file. Or the results could just be collected.
Also it should be possible to easily adapt the code to your wishes:
Maybe you can provide an example with your data _ can be dummy data.
Hi.
Using the Column Resoter Node, I sorted the column data in alphabetical order and obtained the desired results.
Thank you.
Hello all,
I have to combine 2 (or more) density plot. Is it possible?
The problem is very easy: I have a lots of sample of hemoglobin blood analyses. For every sample I have the gender of the person (M or F). Is it possibile to produce a density plot with 2 distinct graph (in the same graph), one for man and one for women?
Regards
Stefano


