Hi,
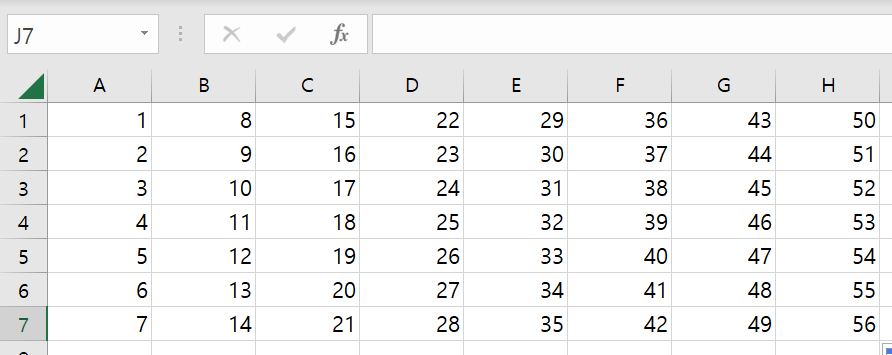
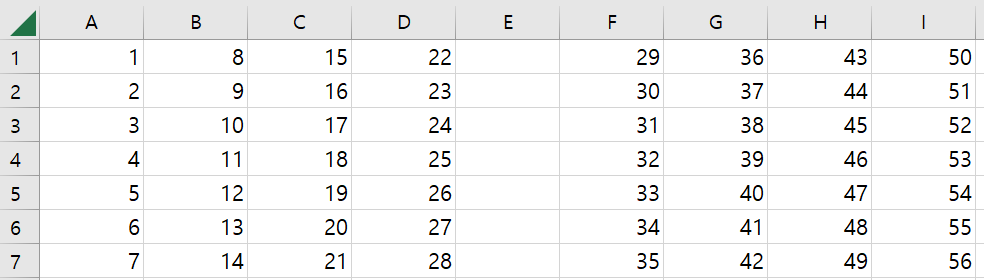
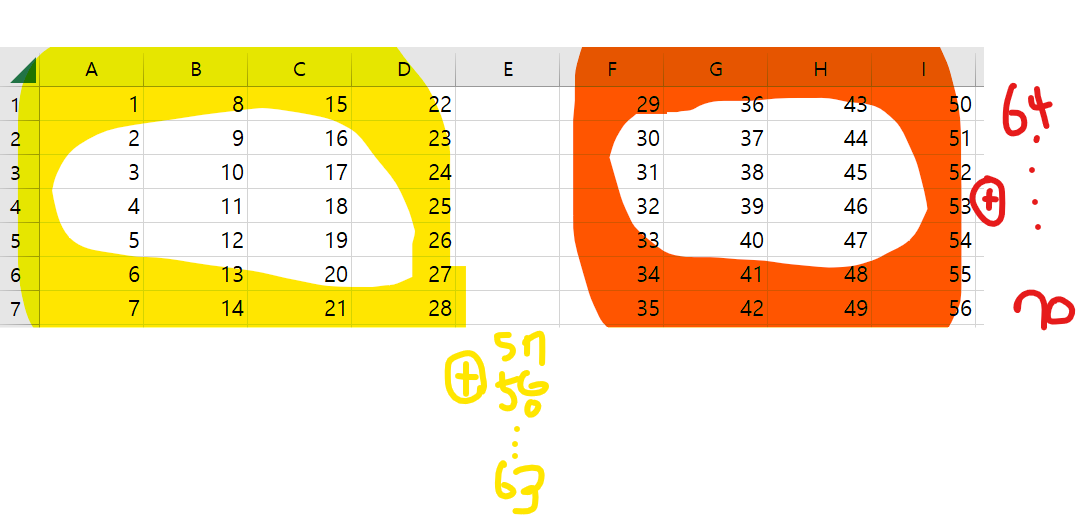
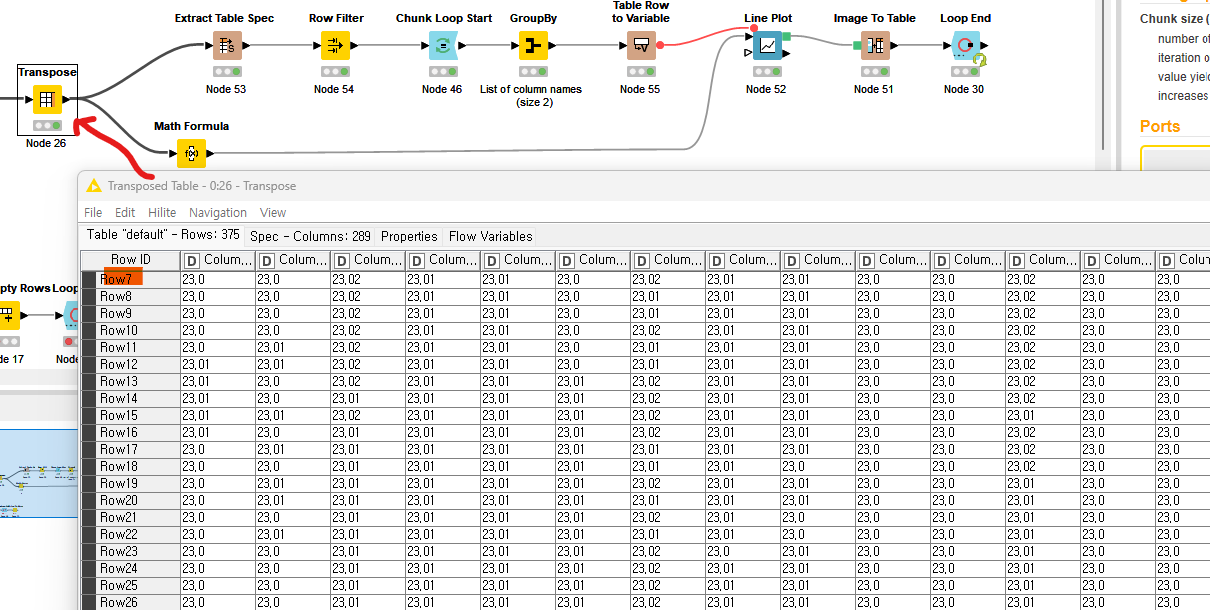
It’s probably best if you first transpose your table with the Table Transposer, because then you can use a Chunk Loop Start and a Add Empty Rows node to add empty rows at certain intervals. Then you can collect with a Loop End and transpose back to your original structure. I am not sure I understand the “Combine with other column data”. If it is just some data from a different source, you can add this before the loop end in each iteration individually with a Concatenate node. This means, of course, that the data you add must also be transposed.
Kind regards,
Alexander
Hi.
Firstly, Thank you for your answer.
I solved some problems with your help.
But, now I can’t make line plot.
I’m sorry, but can you look at my nodes?
Hi,
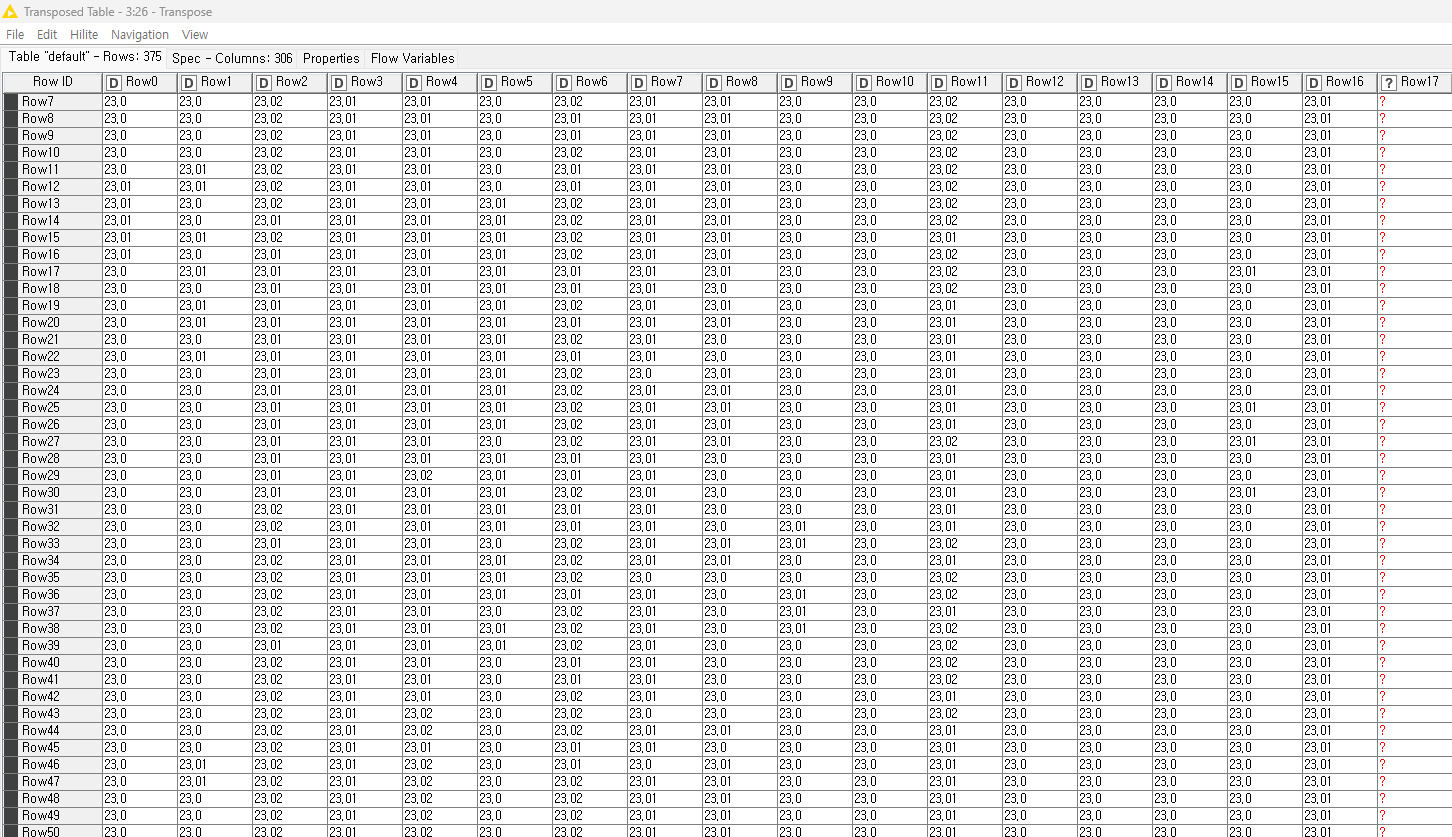
Somehow your columns are of type string, even though they contain numeric data. You can try just adding a Column Auto Type Cast node before the Line Plot to do the conversion for all your columns in one go. Alternatively, you can also use a String to Number node.
Kind regards,
Alexander
Hi.
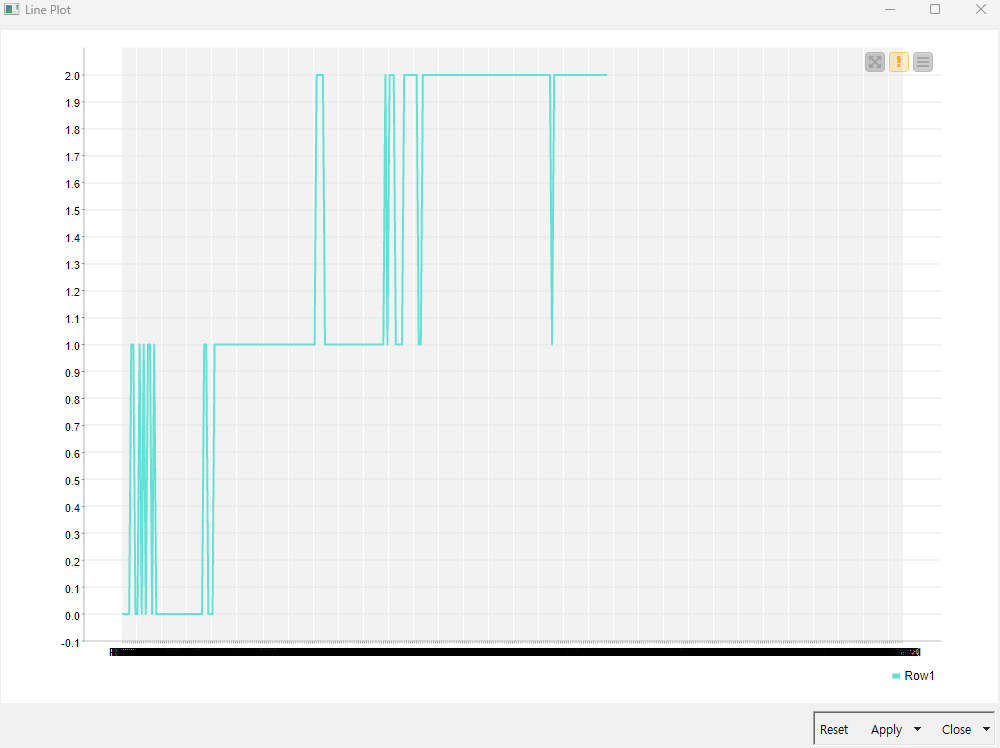
Thanks to your help, the graph is drawn well. By the way, as long as there is column data, I want to draw the graph over and over again, so what kind of loop should I use?
Thank you.
Hi,
You can use a Column List Loop Start node for that. You will need to enable the image output of the Line Plot, then you can collect it using a Image to Table node and pass that to a Loop End node to collect the graphs for all columns in a single table.
Kind regards,
Alexander
Hi.
Let’s say we have 10 column data. Should we use the column list loop start node to draw a graph with 2 data to make a total of 5 graphs?
Thank you my teacher.
Hi,
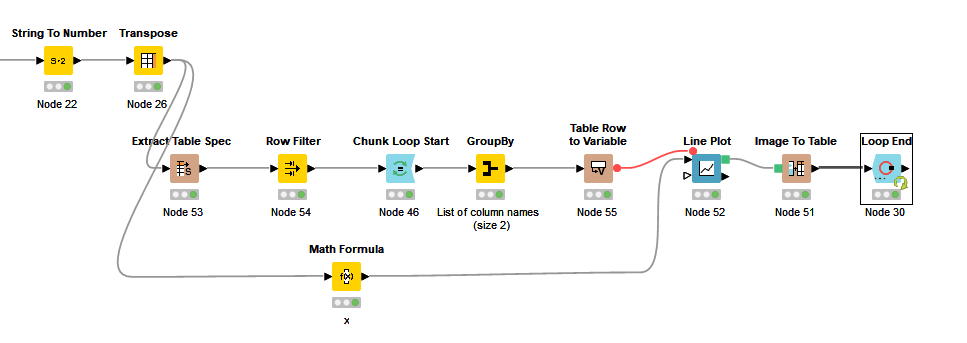
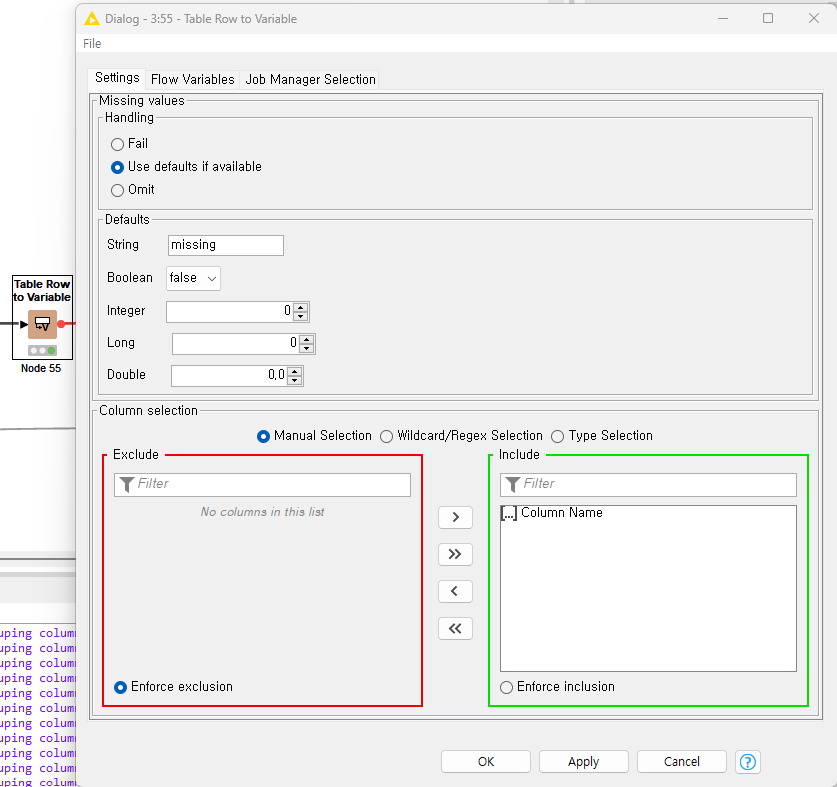
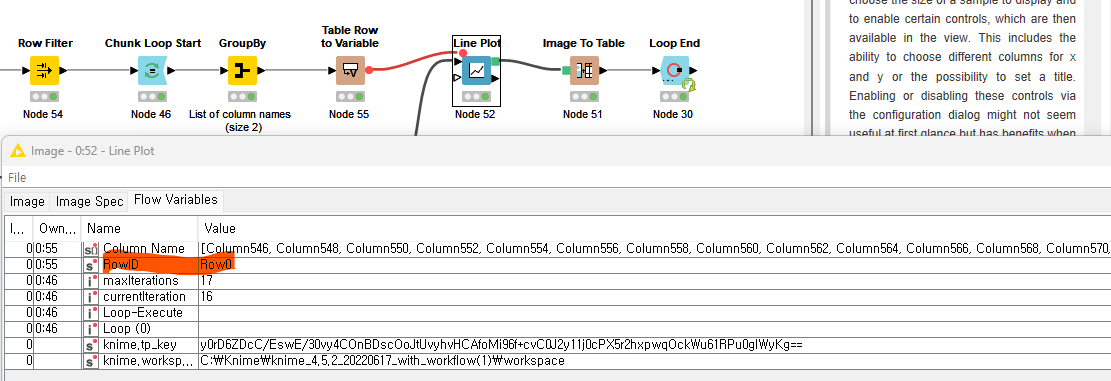
I’ve uploaded a workflow to KNIME Hub here. It shows how to loop through columns in sets of a specific size. It is a bit more complicated than a Column List Loop Start, because we need chunking, which is only available for rows. So we extract the table spec and then loop through the column names in chunks of size 2, convert those names into a flow variable, and pass that to the Line Plot node.
Kind regards,
Alexander
Hi.
I was going to go to the link you told me and download the workflow with drag and drop. But my Knime version is low, so I can’t download it. I’m sorry, but is there any other way to download the workflow you told me?
Thank you.
Hi. @AlexanderFillbrunn
I think it’s almost done with your help. By the way, the final result shows the same graph all together. What’s wrong with setting the node?
Hi,
What you describe now is different from what you asked earlier, where you wanted chunks of 2 columns. I am not sure I still understand your final goal. If you want one graph for each column, you can just use the Column List Loop Start as discussed in the beginning.
Kind regards,
Alexander
Hi.
I’m sorry for the lack of explanation.
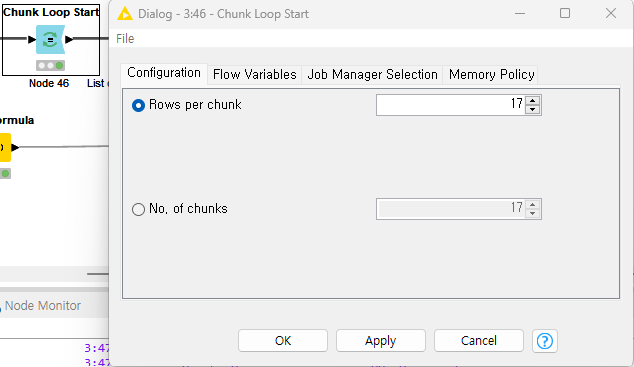
My final goal is to divide 170 column data by 17 and draw a graph so that a total of 10 graphs appear. I want to use a loop for this.
Thank you.
Hi,
This is what the workflow in this post does. There the group size is 2, but you can just configure the Chunk Loop Start to work with chunks of 17 instead of 2.
Kind regards,
Alexander
Hi,
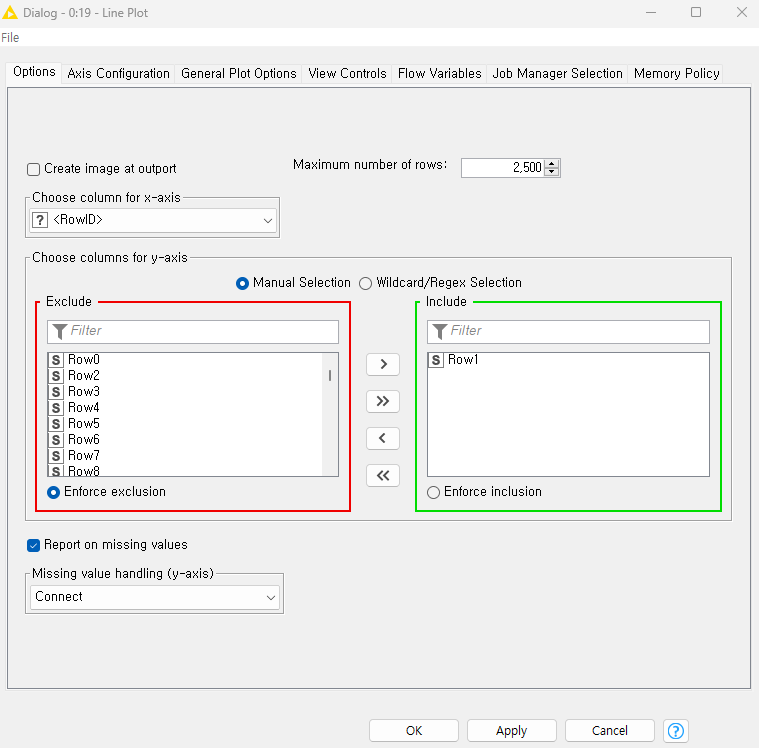
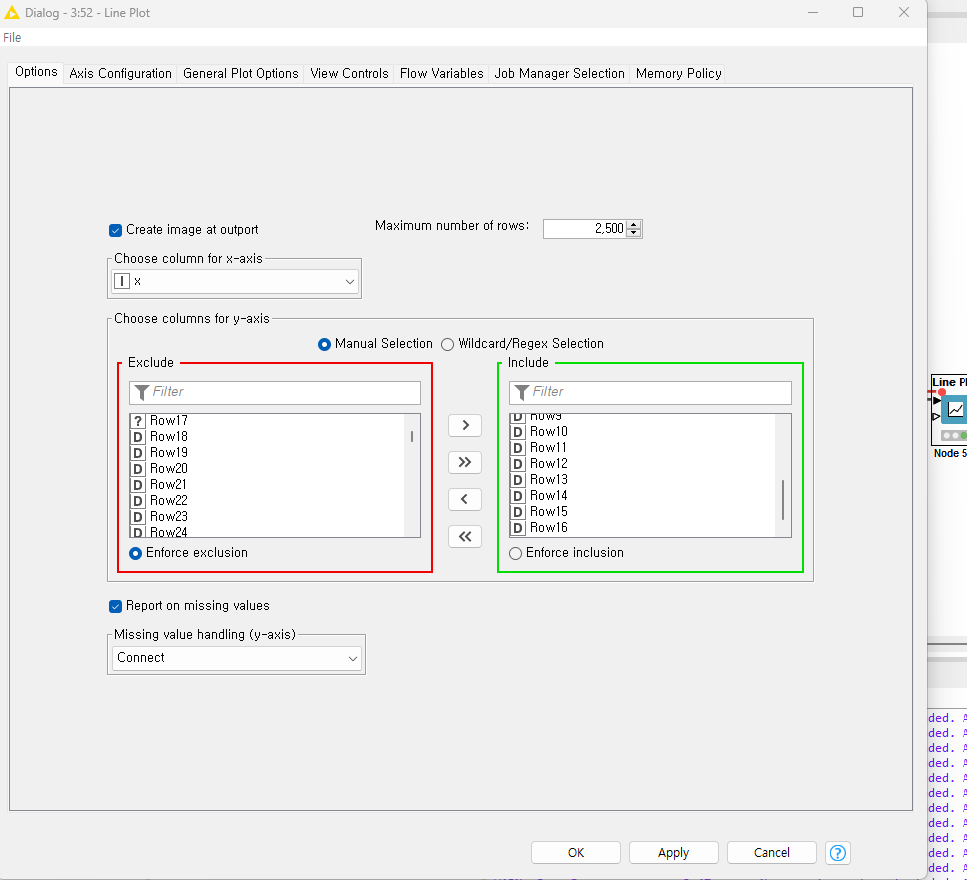
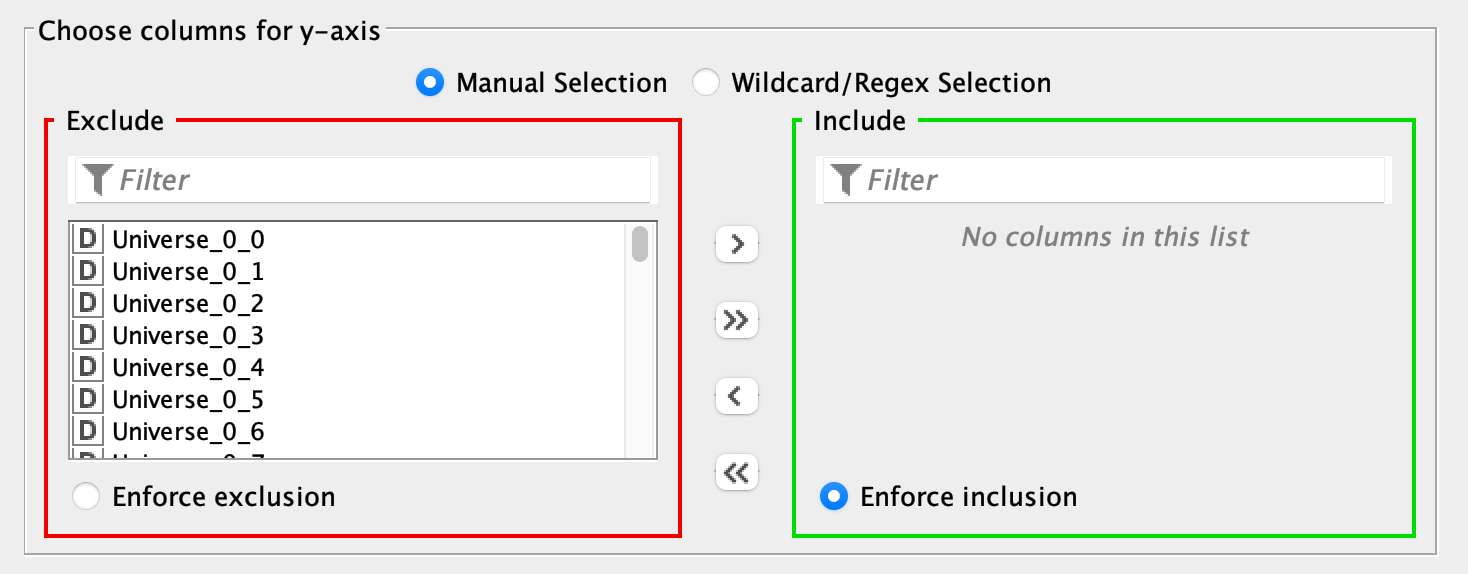
I think the problem is in the Line Plot. There, please make sure to move all columns to the left side and then choose “Enforce inclusion”. Then it only takes the 17 columns from the flow variable.
Kind regards,
Alexander
Hi,
The row ID should not matter. Please find attached a workflow which creates line plots in batches of 17 columns. Does that help?
Kind regards,
Alexander