Hi,
I would like to know if there is any functionality where we can execute a Python script which takes input data and provides a output containing visualization. The node is pretty similar to plotly visualization nodes but instead is it possible to write custom code in Python script node and get a graph as output?
For example, input a data table to a node containing custom python code to create a bar graph and this graph can be output of the node?
Thank you so much for sharing this. I actually got it working for basic things.
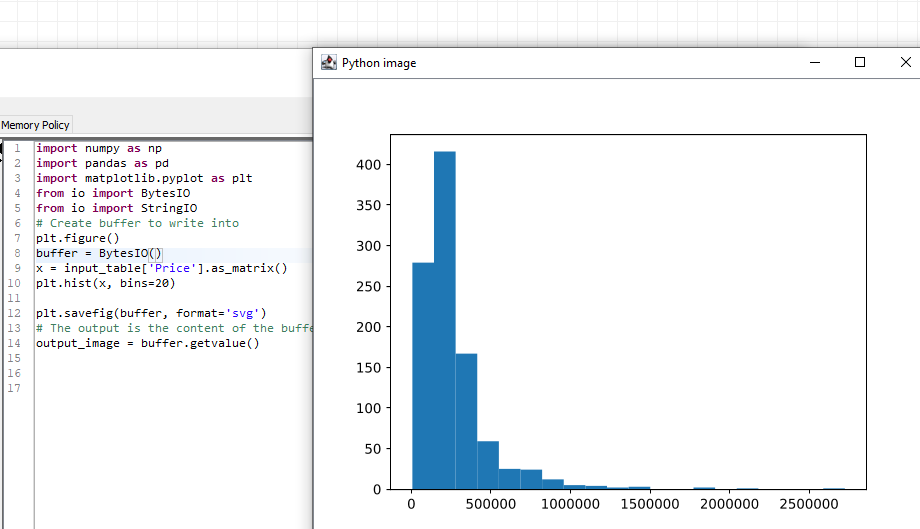
However, when I was trying to build a histogram, I’m able to see it when I execute the script and click ‘Show Image’, but I entirely different image when I execute the node and view the Output image. I think I’m making some mistake while saving it in the buffer.
I tried using StringIO from io package but then I get ‘No Image generated’.
Hi,
There isn’t any error as such. It’s just the script execution results in a correct histogram. However, when I execute the node it gives a different output image like in the screenshot.
I’m not sure where I’m going wrong.