Issue: I am having a problem with creating report, which contains R view generated visuals, using reporting Report HTML /PDF writer nodes.
What I need to achieve: I would like to create a report (mostly in HTML) using visuals generated via R ggplot as it is highly customizable and suits my needs for image requirements for my reports.
What I tried:
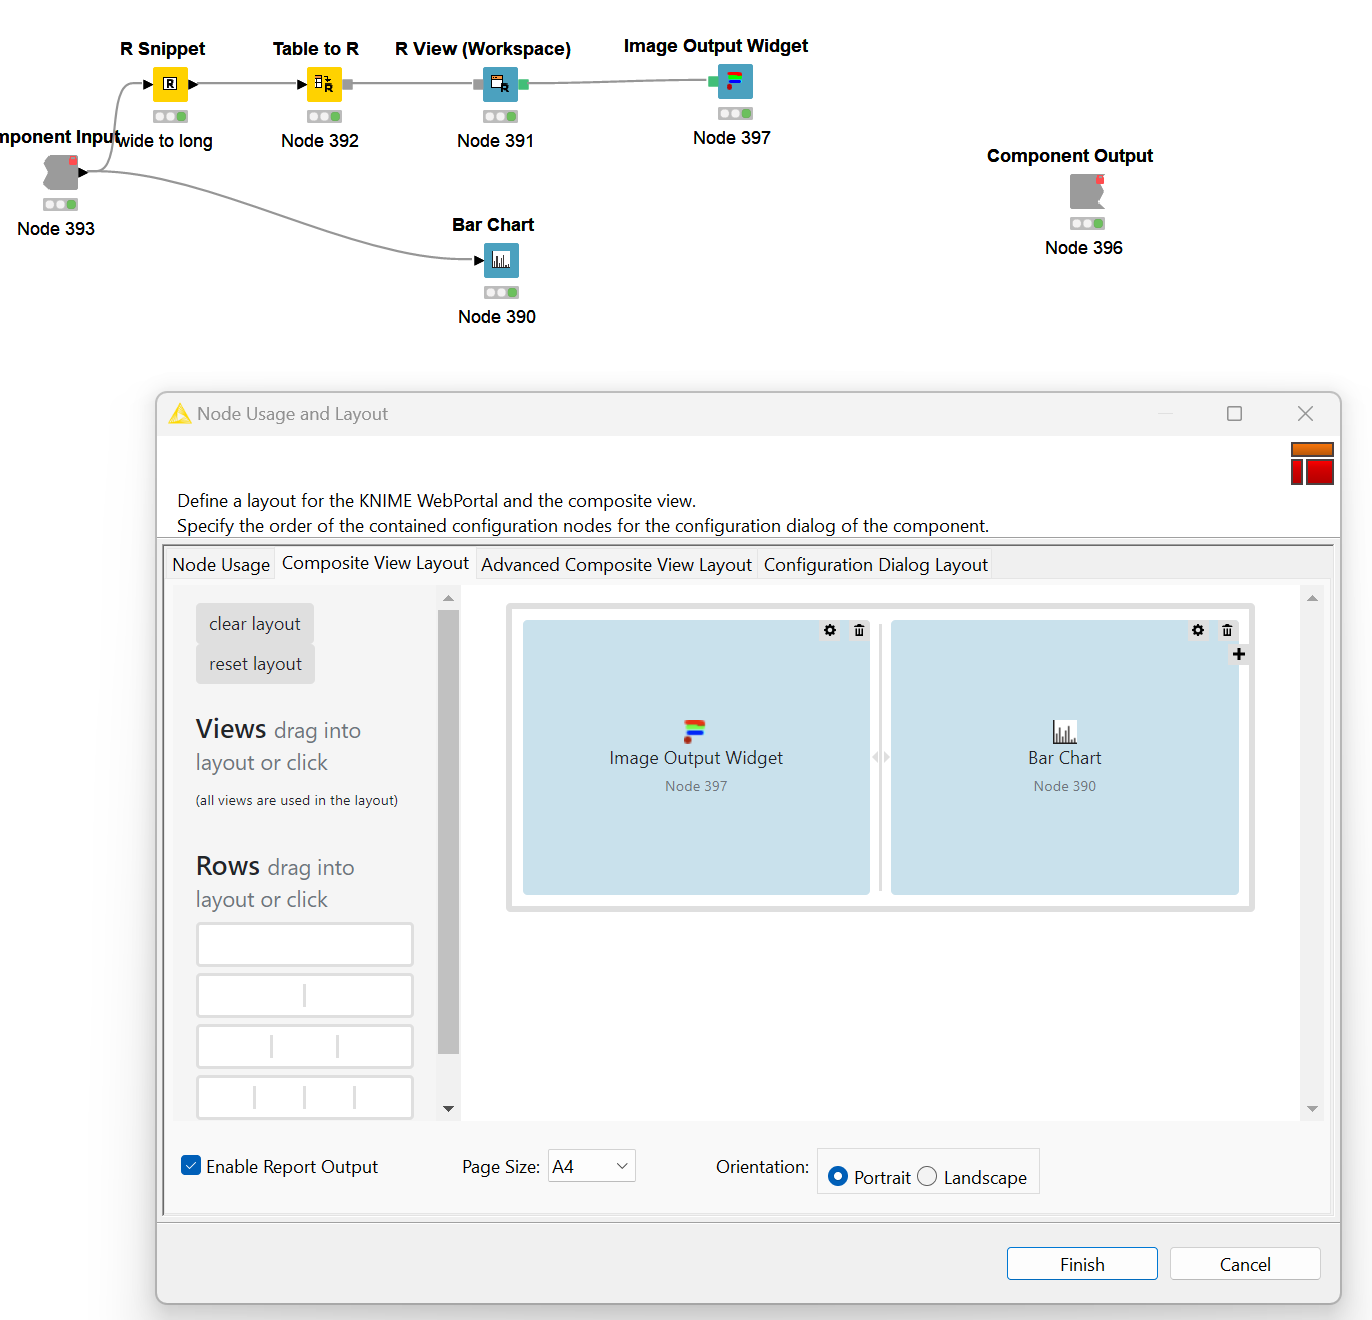
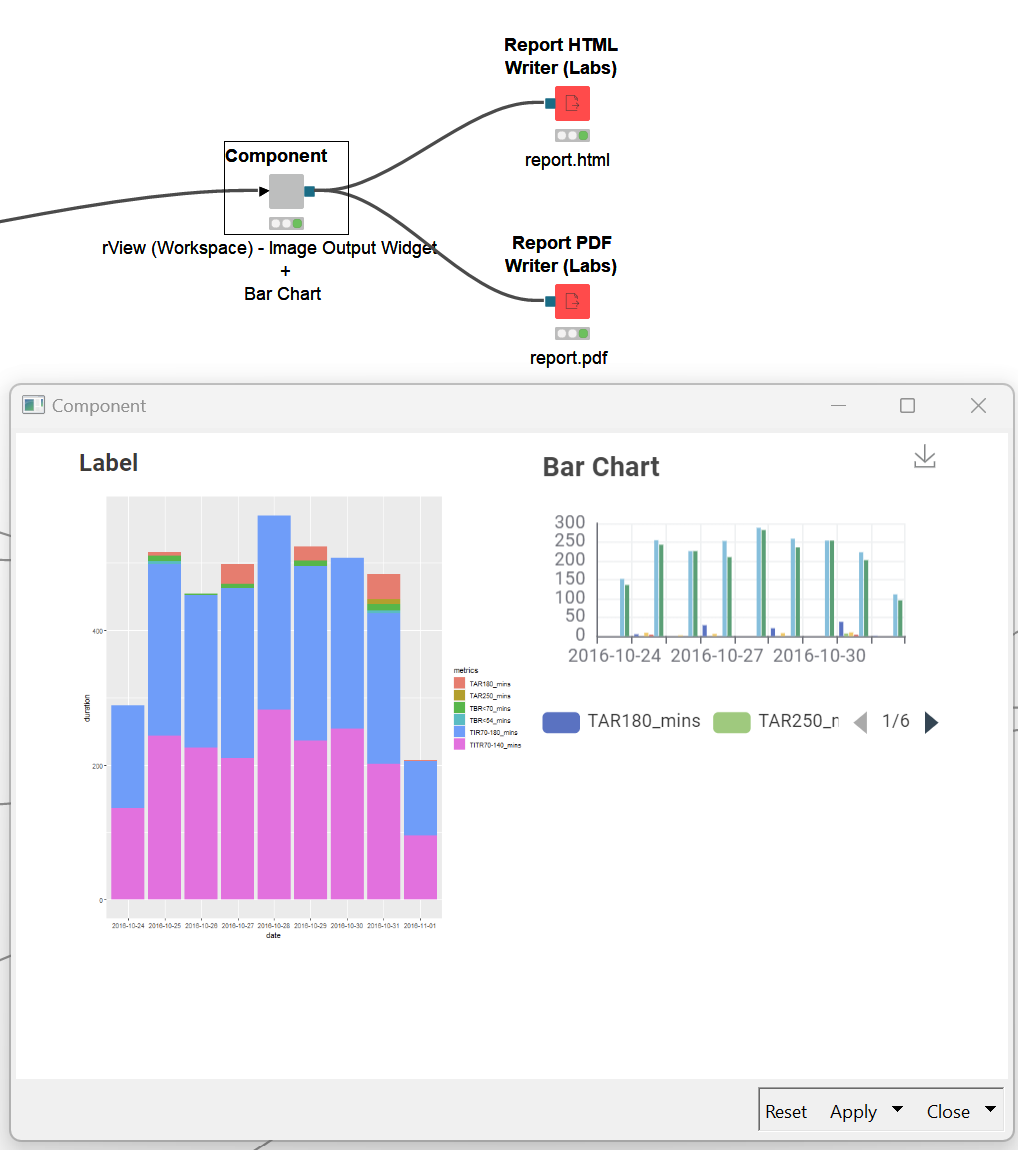
For test purposes, I created two visuals, i.e. (1) one stacked bar chart in ggplot which was sent to output via Image Output Widget and (1) one bar chart using knime original node, within a component. And using the component configuration I created a layout for my (hypothetical) report as can be seen in the below image:
Hi @Odko,
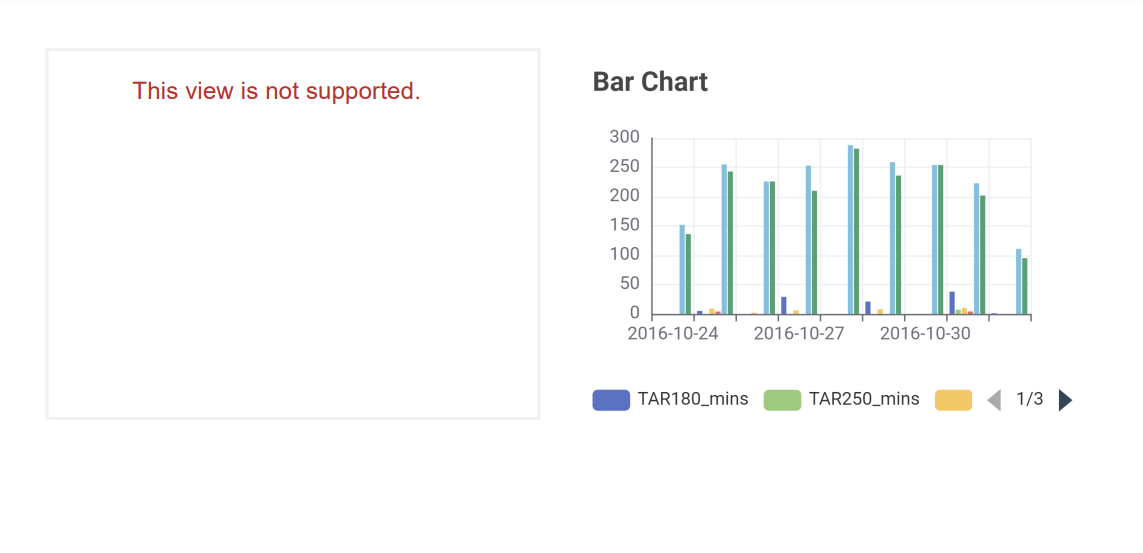
Currently, the new reporting framework supports all the newest view nodes (the ones with the new configuration UI) and the Text View node that is present in the reporting extension. In our nightly build, there is already an updated Image Output Widget that is supported as well, but it has not found its way to the official release yet.
Kind regards,
Alexander
Hi,
I think the new widget will be out by 6th of December. I am not aware of any workarounds, sadly, because we do not have a node yet to turn HTML text into report content. If we had that, we could build our own component to render the image.
Kind regards,
Alexander