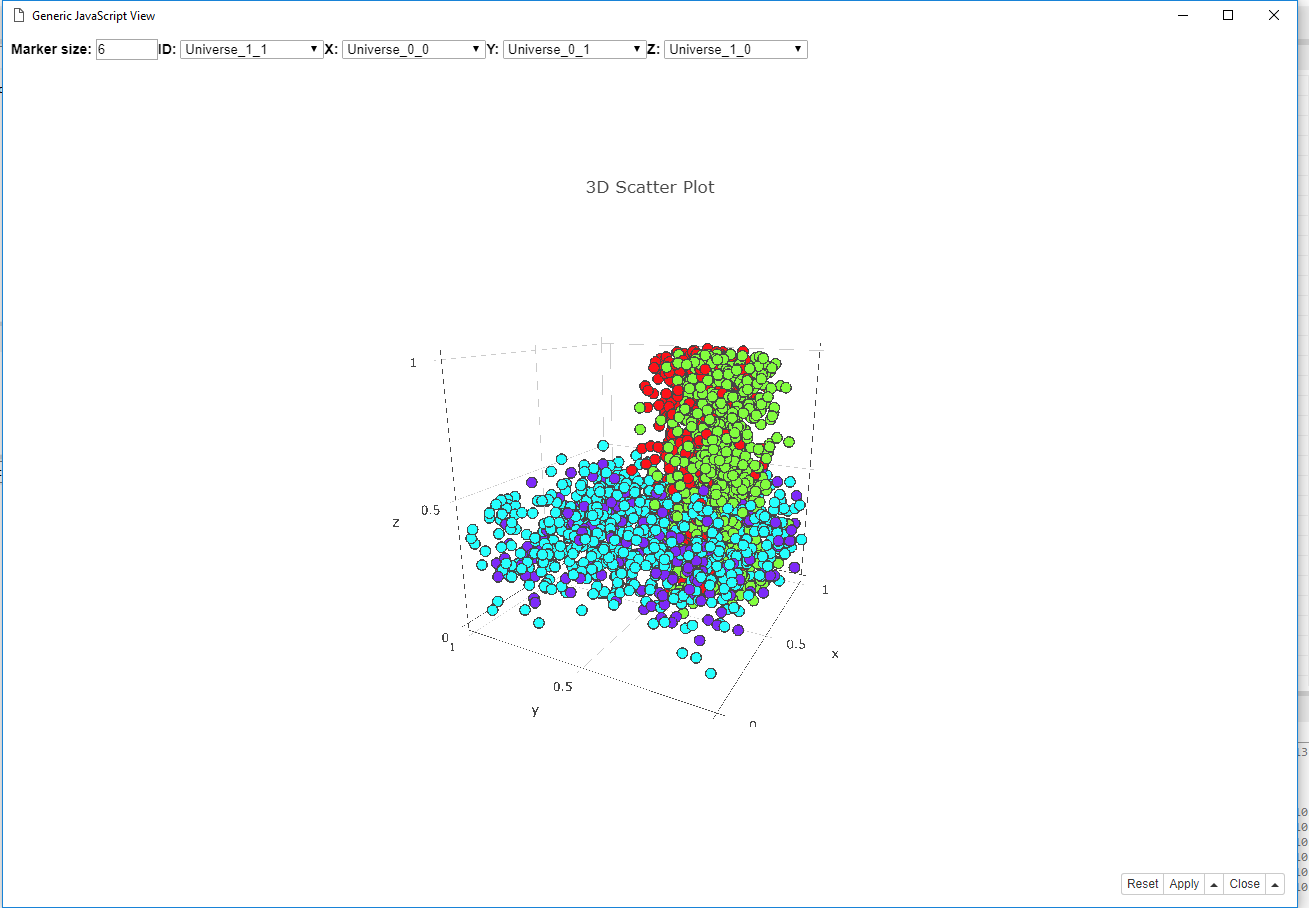
Marker size, X, Y, Z and label are all dynamic and defaults index positions are set manually.
So this may already be useful to people but I’d like to try make this an actual node, particularly as the Generic JavaScript View doesn’t seem to have a save template function? Would be nice if selections were remembered too.
Where’s the best place to take a look for inspiration and is there any documentation of the JavaScript table and node development. I remember some content was covered at last years community developer meeting but at the time I knew even less JS than I do now and didn’t really follow.
looks like a cool visualization. Unfortunately there is not a lot of documentation about the JS capabilities of KNIME, yet.
What you can do is download the sources for the JavaScript extension of KNIME under Install New Software and then look at the source code of their nodes under Eclipse/plugins/org.knime.dynamic.js.base_3.5.x/nodes.
These nodes are generated via the dynamic JS node generation framework by @albrecht.
In short, you need to use the KNIME SDK, create a new plugin that extends the extension points provided by this framework (see their plugin.xml), add folders for your nodes, describe them with a node.xml (“just” follow the XML schema), add the Javascript and CSS snippets for every node and then they are automatically generated at KNIME startup.
The pros: You can distribute them as native nodes; they have their own configure dialog; you can have annotated output or complete output tables and you can ship dependencies (like plotly).
The cons: Some work.
AFAIK if you just want to use the selection capabilities this should be possible in the Generic JS Nodes, too. You need to register for selection events and implement a method on what to do when new selections are made. You can of course publish them, too. A good starting point is the Parallel Coordinates plot of KNIME. There they use all kinds of filtering and selection events.
Concerning plotly: Be aware that svg export is only available in the pro version.
Hi Sam,
Did you make your js code to be an actual node? Now I need to make JavaScript code to be a node too and I find this page…
If you already made it ,could you plz give me some tips or show me a demo file or something .
Unfortunately I haven’t had a chance to do this yet. This was an out of interest project rather than out of need so harder to find time for.
I have found out from another project although you may not be able to export as SVG you can implement that functionality fairly easily yourself for the graphs that are drawn as an SVG (most of them).
Hi Sam,
I don’t need to export SVG, I just want to know how to integrate JS code with nodes.
Although I didn’t get the answer I wanted, but your reply has made me very happy
Anyway, thank you for your reply, thank you very much.