Hi all, I want to have datetime on x-axis of my scatter plot but it appears that JFreechart (scatterplot) only takes number as input. Can anyone please help me with this ??
Thank you!
Hi all, I want to have datetime on x-axis of my scatter plot but it appears that JFreechart (scatterplot) only takes number as input. Can anyone please help me with this ??
Thank you!
Hello @Anoshpananda,
is there any specific reason why are you using the one from JFreeChart extension as there are 2 newer Scatter plots that can help you:
Additionally if you have opened up a topic regarding your issue it’s not necessary to write about it in other topics. Helps us keep the forum clean. Tnx!
Br,
Ivan
I want to put scatter plot in the loop and after the end of the loop , I want the data to be stored as png , which I think can only be done using JFree that’s why and yah sorry for posting it in another topics that were relavent that is why I posted. sorry for the inconvenience 
Hello @Anoshpananda,
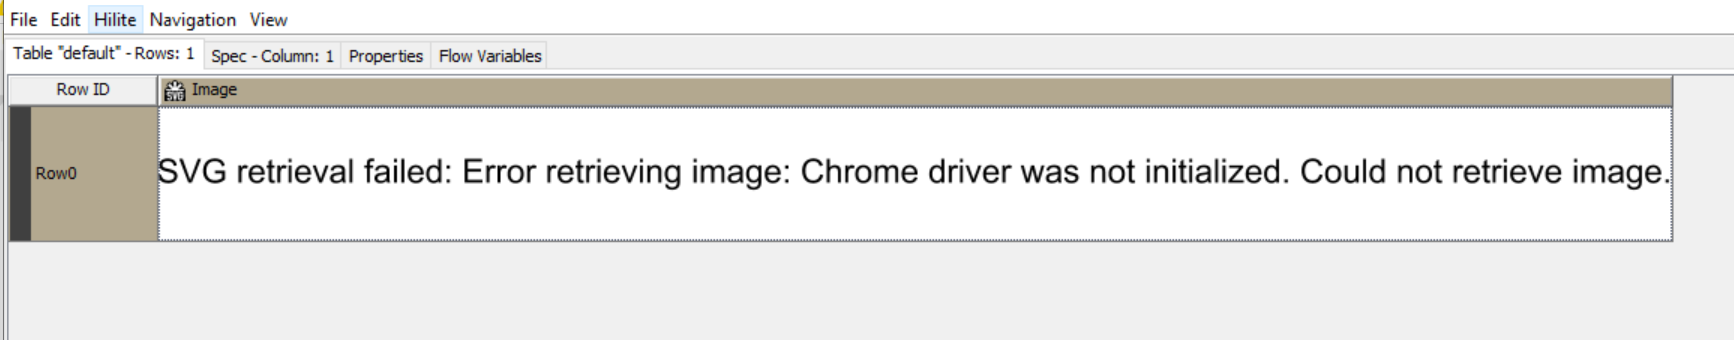
I see. Then you can use Renderer to Image node to get PNG images from generated SVGs. (Prior to it you have to use Image To Table node but guess you are using it anyways as you are using Loop End node.)
All fine 
Br,
Ivan
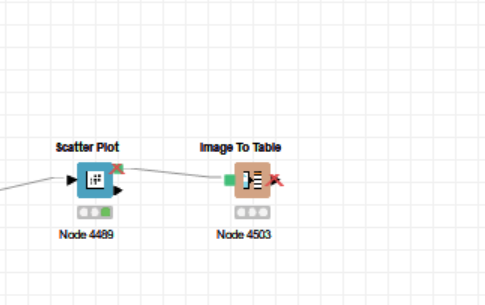
I am not sure how to connect scatter plot to Image to table 
Managed to found the solution 
Prefs>Knime>Javascript views > internal SWT Browser
Hello @Anoshpananda,
glad you found a way. However regarding your picture you can see you have red cross over image output port. I wonder have you checked option Create image at outport. Without it image won’t be created. If you have this option checked then I guess you solved it with changing your preferences.
Br,
Ivan
This topic was automatically closed 7 days after the last reply. New replies are no longer allowed.