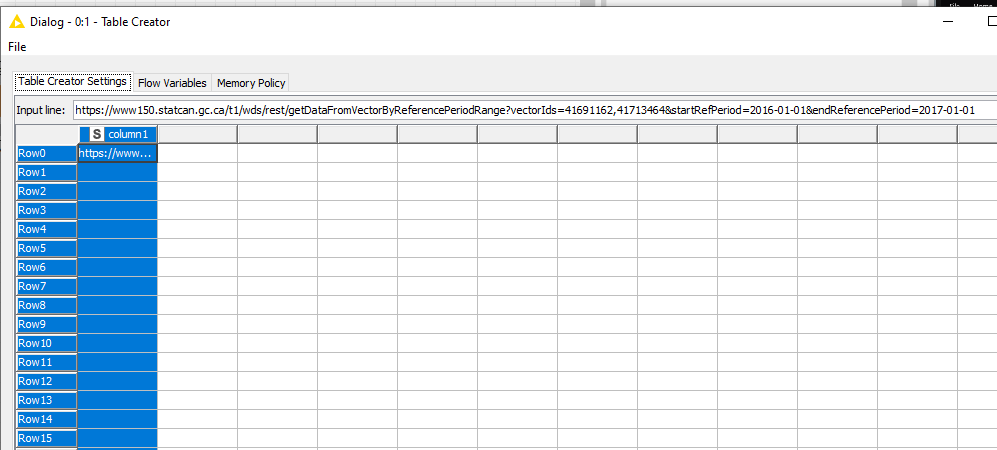
I have a basic process that calls data from Statistics Canada (aka “StatCan”). The data pull appears successful, but I’m having trouble understanding what to do next to get the data in a table I can use.
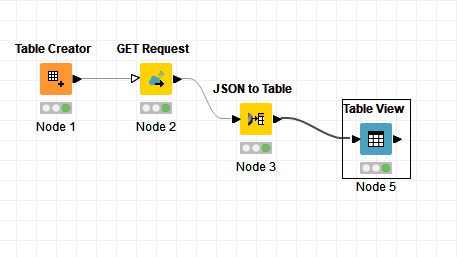
Here is the overall process:
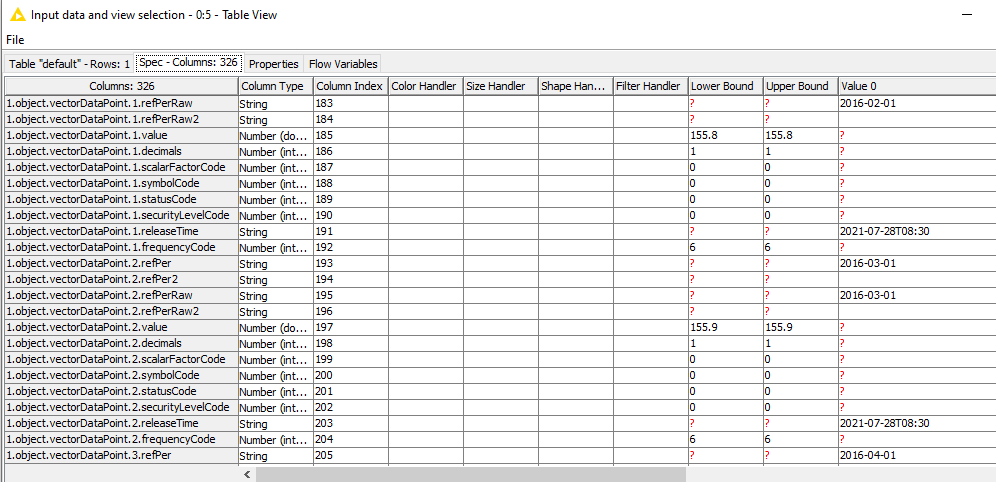
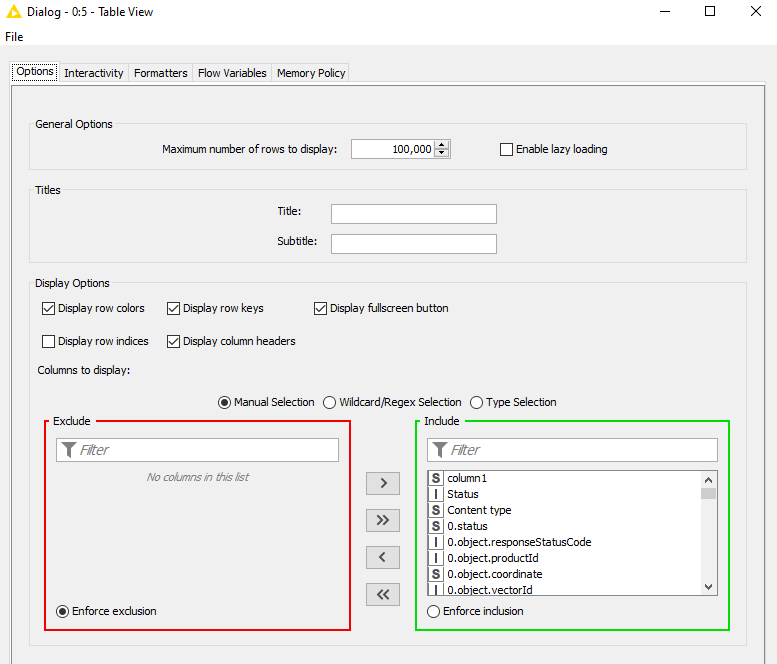
Here is the resulting view, bare in mind that the rows are actually columns:
The desired result is such that essentially I should have date in one column, and the values in the second column (which in this case, appears to be in two places: lower and upper bound).
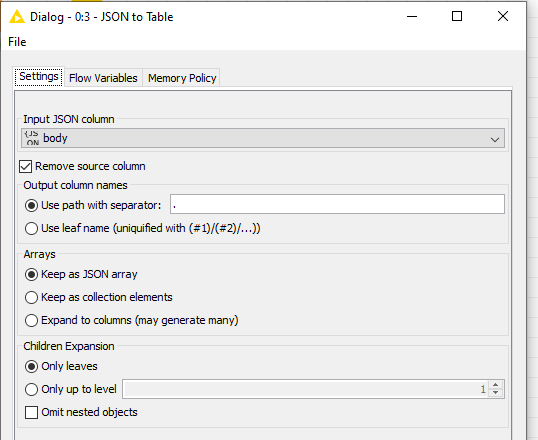
The idea is to use the JSON Path node to define the values you are interested in. You can add more values to the table by looking for the value in the JSON that you can see in the configuration window of the JSON Path node, selecting the value and clicking on the Add collection query button.
Please have a look and let me know in case of any questions