Hi to all,
I am using the DBSCAN algorithm and I want to determine the values of MinPts and Epsilon.
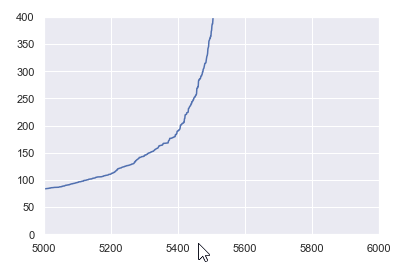
For the MinPts there is a theoretical way to find it, meanwhile, for determining the Epsilon there is another way by using the NearestNeighbors algorithm, to calculate the average distance between each point and its n_neighbors. Then you sort distance values by ascending value and plot to find the elbow in the plot. It should be something like this
How can I implement this in Knime? Did somebody use this technique to determine epsilon while using DBSCAN? Which nodes should I use?
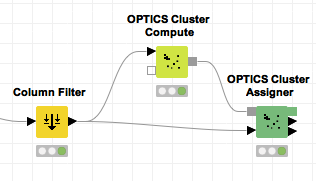
@izaychik63 thank you for your response. Do you mean the node Optics Cluster Compute? I don’t see any graphical output here or am I checking the wrong node?
@izaychik63 I tried this and it works, although I can not order the distances of the graph. Have you used it for determining the epsilon? Any idea how you chose the best epsilon?