Hey Everyboy,
I´m in focus of the K-Mean algorithm for a while.
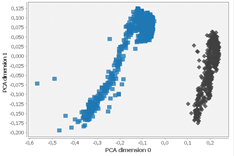
I like to have a Plot like this
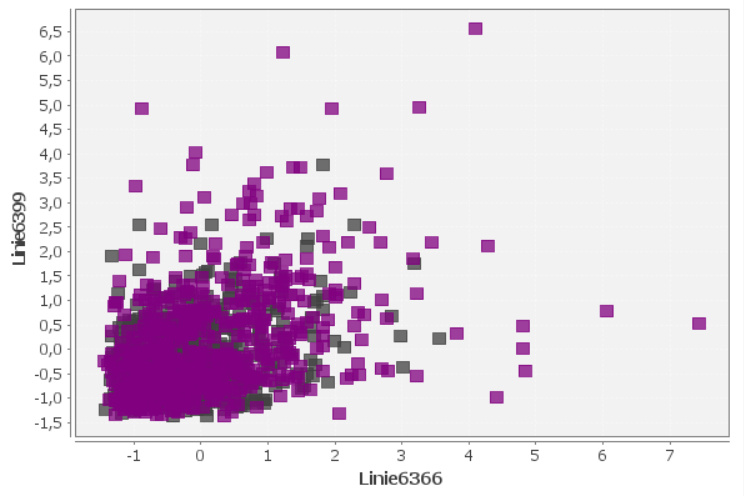
But now I get a plot like this

I tried some distance/matrix node, but with no succuess.
Do you have some idea?
Thank you for your answer.
Johannes
Hey Everyboy,
I´m in focus of the K-Mean algorithm for a while.
I like to have a Plot like this
But now I get a plot like this
I tried some distance/matrix node, but with no succuess.
Do you have some idea?
Thank you for your answer.
Johannes
Hi @Koalabar -
Can you upload a workflow with some dummy data so that we can have a better idea of what you’re doing?
At a glance, it looks like your first plot is of principal components, but I can’t tell what your other plots represent. So some additional context about your use case would be helpful too.
Hey Scott,
Thank you for your help.
I have different sensor data from the state of a machine and thats basically my issue.
My goal is to use ML to find a way to recognize patterns and to select good and bad conditions.
Yes the first picture represent the PCA.
At first I wanted to analyze the PCA and K-Mean individually and compare both to the end with the Plot or other statistic nodes.
After that I would like to combine both before I use supervised learning.
I hope this will give you a better background in this case.
Thank you
PCA.knwf (291.8 KB)
K-MEAN.knwf (342.1 KB)
Sorry for the delayed response here. I’m still playing catch up after the Fall Summit.
I loaded up the workflow and have been tinkering with it. The first thing that jumps out is that in your Excel Reader node you are reading the “Bad” dataset in both the top and bottom branches, instead of comparing Good vs Bad. Is that what you intend?
Hey Scott,
thank you for your answer.
Yes your are right, I would like to compare both, so in each reader should be a different condition.
Is that the reason why you are getting unexpected results - comparing Bad to Bad, for example - or is it something else?
comparing Bad to Bad was just a mistake while transfering the dataset .
So this is not my problem.
What exactly do you expect? When you want to plot your kmeans results afterwards you probably need pca to get 2 components you then can use for your x and y axis
BR
Hey Daniel,
In the meantime I have the suspicion that this comparison does not work because I need an x and y axis.
Thank you .
Is the process that I have described logical? Or are there any ideas?
BR
Johannes
This topic was automatically closed 182 days after the last reply. New replies are no longer allowed.