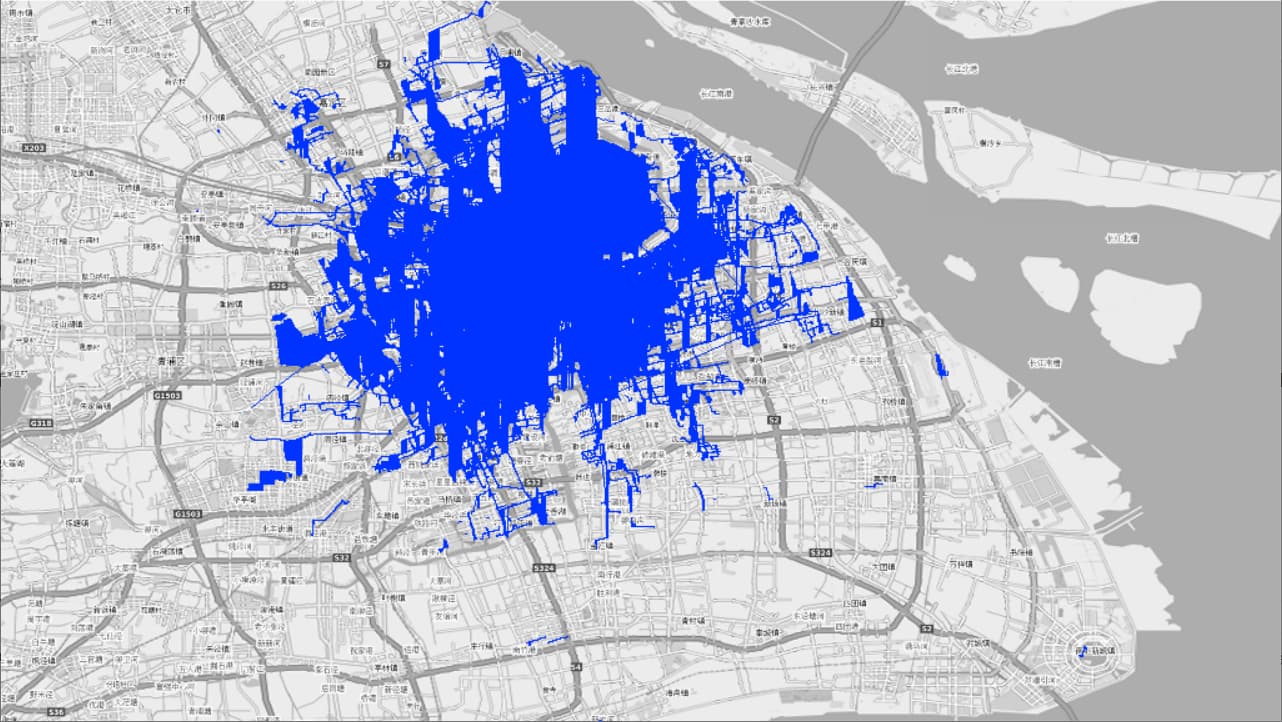
I collected a collection of Mobike trajectory data from Shanghai on the internet, in CSV format. The dataset consists of over 100000 pieces of data, including order number, vehicle number, user number, order start time, start position longitude, start position dimension, order end time, end position longitude, end position dimension, and cycling trajectory point.
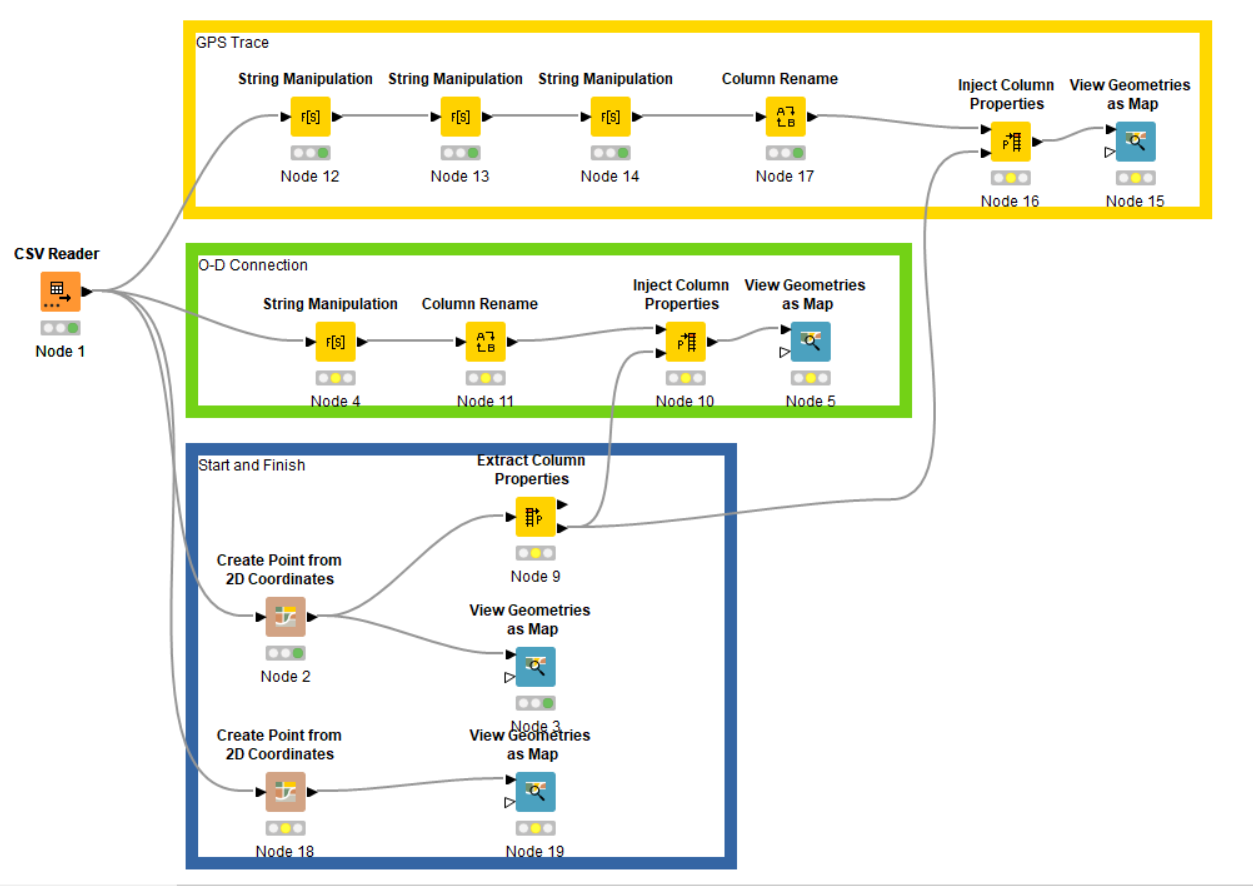
I don’t want to use Python or R to handle it because I’m not good at it myself. So I wanted to try using KNIME, but I didn’t expect the processing efficiency to be very good. Take this opportunity to share with everyone.
Of course, KNIME can not only do these things, but also combine them with open-source JavaScript, such as creating various analysis graphs, dynamic graphs, etc. for easy display. This is also one of the directions I will continue to explore in the future.
Of course, currently KNIME has released a geospatial node library, which can also be combined if you are interested. They are all very good node libraries.
Your workflow looks great! Thank you for sharing it. If you’d like, you can share it on the KNIME Hub so that other members of the community can benefit from it. I appreciate your contribution.
Hello @jinwei_sun , thank you for your message. I am sorry I don’t know how to upload to the KNIME Hub yet. I am really interested in knime and would like to share some of my own usage experience with everyone. Of course, I have also learned a lot from forums. I hope to have the opportunity to consult you more in the future. Continue to work hard to learn and improve. Thanks again.
Communicate more.