I need to perform a comparison of rows of data and I am struggling with the logic/nodes that I need to use
With reference to the below table, what I need to do is:
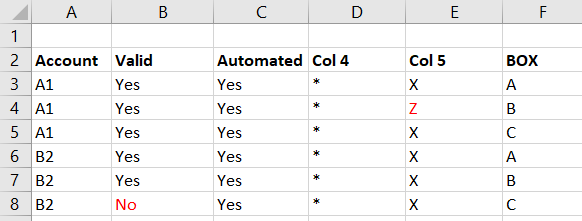
Net - For each account in Col.A, I need to compare all cells for each row for the same account (no matter how many) to the row for box A.
Example, I need compare the data in Row 4 and 5 (Box B & C) to the data in row 3 (Box A). I then need to call out any differences in the data - e.g. On row 4, the data in Column E for Box B doesn’t match Box A (Z compared to X).
Once the comparison has been completed for Account A1, I need to loop through every different Account in col. B - i.e. next up is B2, and call out any differences for that group (there is a difference on row 8 in column B).
I know that I need to use a loop (i think a Group Loop based on Account) but I can’t quite nail down how to do the comparison of the data.
Is it always the rows in Col5 only that will be compared to each other?
Are the comparison always done against the row with BOX A of the Account?
What would the output table look like? If we take your example where “On row 4, the data in Column E for Box B doesn’t match Box A (Z compared to X)”, so we found out that “Z” does not match “X”, what do we do about it?
Also, can you please share some sample data that we can work with? We can’t copy the values from a screenshot.
Test Data is in the below file. Test Data.xlsx (16.8 KB)
Answers to your questions:
Yes - there will always be a BOX A for each account.
No - all columns need to be compared to each other (except for SAP box as this will never match).
i.e. Does Col.B for row 4 = row 3, Does Col. C for row 4 = row 3, Does Col.D for row 4 = row 3.
The base for comparison is always Box A of the account.
i.e. Box B compared to Box A, Box C compared to Box A. (NB. There will never be more than 1 row for each box/account combination).
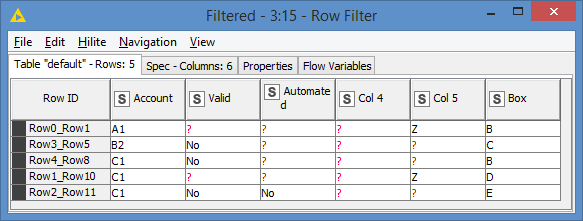
Ideally I only want to see rows and columns that have an issue (see example output in attached file ‘Example Output’). If this is not possible, something like the second table in the attachment would work (and I can then filter on difference columns with an X)
Note - as per data provided there won’t always be the same number of rows (e.g. for B2 there are now 4 boxes versus 3 for A1). This is why I was thinking of using a group loop so all instances per Account are tested.
For the output, the second one is typically an Excel output where you can just copy and paste in Excel. It’s not as simple as that in Knime. The first one makes a bit more sense.
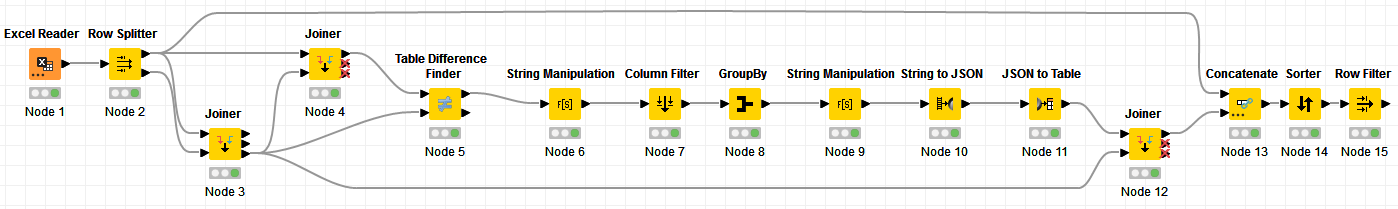
I put something together for you that achieves this. The high level logic is:
Split the table into 2 sets of records, the records with BOX A (based on your answers, it should only give 1 record per Account) and the rest
Do a Left/Right join (depending on which table is left and right) between the 2 tables, joining on all fields except for the BOX field. This will give us the records that are different from BOX A
After that, use the Table Difference Finder. For this:
i) Based on the amount of unmatched records, build a reference table matrix using the values of the records of the BOX A
ii) Compare the matrix with the unmatched records table
The Table Difference Finder will give us the results vertically. Manipulate the results and build the results into a JSON string - the reason to use JSON here is to be able to use dynamic columns, since the Table Difference Finder will only show the columns that do not match of each row, which is what you want.
And for making the demo more interesting and to cover more use cases, I added additional records for C1.
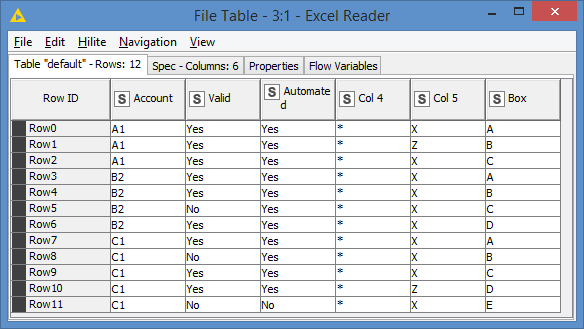
Input data looks like this:
New use cases added in the C1 Account:
BOX E has more than 1 column that does not match
And of course, C1 has more unmatched rows than A1 or B1
NOT a new use case, but just a note that BOX C matches BOX A, so it will not return as unmatched.
Just a little note there: I concatenate (Node 13) the BOX A rows with the results, and then eventually removed them with the Row Filter (Node 15). This is a bit of a hack to get back the original table structure. But it could also be useful to keep the BOX A rows just to compare what’s unmatched.
Without removing them, the results would look like this (just check the results of Node 14 basically):